Twitter

Showing posts with label DJIA. Show all posts

Thursday, February 23, 2017

Market Behavior and Impact on Gold


Market Overview

Markets have rallied very significantly. First burst of the rally was after election till mid-December and the second burst has been from end of January till today. Impressively, our proprietary Market Classification Model remained long stocks during this entire period. Model turned bullish soon after Brexit and has remained bullish since July’16.

Although in the hindsight one can easily say that the market rallied and it was prudent to remain long throughout this time, most of the market participants did not stay long. In fact, there have been significant bursts of pessimism during this rally. For example:

  • Brexit induced anxiety
  • Election related stress
  • Post-election disbelief
  • Post Executive orders convolution

However, these kind of market panics are the very reason why this market has been able to rally this far – Market likes to climb a wall of worry.

Now that stocks have rallied sharply over the last two weeks, we are approaching a period of consolidation. Consolidation doesn’t mean a sharp decline rather a period of sideways action like we saw in January, to digest recent gains. A potential scenario is market topping towards the end of February, according to Inflection Point Model and then consolidating till next earnings reports to justify high prices.

Once this consolidation phase arrives, other assets like Gold are likely to outperform.

Gold

Gold has been consolidating for some time. And this consolidation is supported by a series of higher highs and higher lows, which means that the next stage rally could be very significant. Gold also remains in a Bull market and would be an ideal candidate for a continued rally.

Following chart shows Gold performance over the past 2 months, where a steady uptrend is clearly visible.

 
Gold stocks are also tracing out higher highs and higher lows. In fact, following chart shows a potential head and shoulders pattern being crafted out by the Gold stocks. Once this pattern is completed, Gold miners can easily make a run for the summer 2016 highs.


 Latest MCM report included details about Gold’s uptrend and where the trend is with respect to the overall bull market.

Upside potential is further amplified by the fact that Gold performs very well in an inflationary environment and with rising interest rates, we are likely entering an inflationary environment.

If your interested in free e-mail list or in Market Classification Model, please fill-out the form below.




Wednesday, October 5, 2016

September Performance Recap

September was a volatile month in the markets.

If you look at the SP500 chart, it has been going sideways and frustrating many market participants.


As we mentioned in the last post, pretty much all the major asset classes have experienced sideways action over past month.

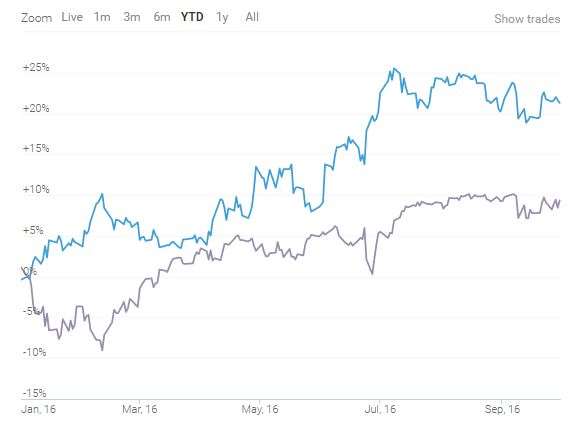
2016 has been a volatile year so far with markets declining sharply in Jan and February, followed by a nice rally. During these volatile times, our proprietary strategy has out-performed the SP500 by 16.3%.

SP500 Performance (Jan - Sept) = 7.8%
Conservative Strategy (Jan - Sept) = 24.1%

Cumulative performance since January in relation with SP500 (total returns) is shown below:


Monthly Performance: 

Following chart shows monthly variation in performance.


Model is agile enough to take advantage of trend changes and re-allocate in strategic positions prior to big market moves.

All of these returns are for a portfolio whose current Beta is 0.32 and whose YTD Beta is -0.57, which means that these returns are totally uncorrelated with the market. Therefore, portfolio has a very high Alpha.

If interested in free e-mail list or in paid services, please fill-out the form below.


Sunday, October 2, 2016

September 2016 - Market Recap

September was a volatile month for all asset classes, as it started with a sharp decline in Stocks, Bonds and Gold. We will discuss these assets below and will leverage this information for October forecasts.

However, need to highlight that last IPM turn window was scheduled for September 26th. Market has made a bottom on September 26th and it's possible that we will see a sharp rally in the next few weeks. We will share details on the IPM turn window in next couple of posts. We are already positioned in our aggressive IPM based strategy to take advantage of this date.

Bonds

  • Since the start of September, Bonds experienced severe decline
  • Decline brought out the bears, as expectations of an impending FED rate hike increased
  • The decline was so severe that at one point, TLT has decline -4.4% by mid month
  • This decline was followed by a sharp rally to near break-even levels for the month
  • In summary: A lot of volatility but no real action / direction, which is apparent from following chart

Stocks

  • Stocks opened September slow but soon after the long weekend and on the heels of a strong jobs report took a nose dive

Gold

  • In contrast to Stocks and Bonds, Gold started with a sharp rally. However that rally fizzled out
  • Since then, Gold has been going sideways. There are two options for the Gold in the month of October:
    1. Gold and precious metal complex has already bottomed and will soon rally to new highs
    2. Gold has traced out a triangle and will decline in October, to mark a bottom
  • Both of the above scenarios suggest that the metal will be higher in future months. The question is whether it will take a detour to lower prices before rallying


Summary

  • Consolidation is the name of the game
  • Overall SP500 gained +0.02 %, Bond lost -1.7% and Gold gained 0.7%
  • We will soon see a well-defined trend but volatility might continue till Presidential elections in November.

Upcoming Blog posts:

  1. Strategy Performance - September recap
  2. Forecasts for October
    • Stocks - Elliott Wave and IPM Model
    • Bonds - Structure and relationship with stocks
    • Gold - Long-term targets and patterns
  3. Performance of Options strategy based on IPM Model

If interested in free e-mail list or in paid services, please fill-out the form below.


Thursday, September 22, 2016

Correction Complete - Approaching Vacuum

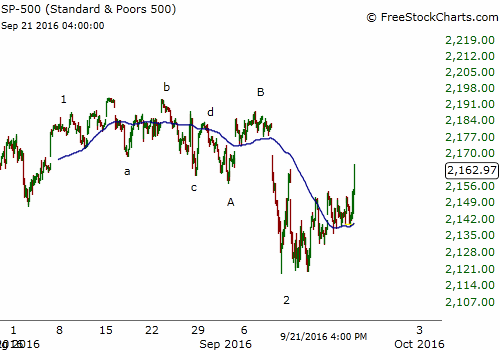
Near term market structure suggests that market has just completed a correction. With intermediate trend up and recent sell-off triggering several buy signals, it seems like we are on the cusp of a major rally.

Following chart shows the correction count, since early August.


Since August 8th markets have gone sideways. This sideways action culminated on 9/9 with 400 point decline in DJIA. If the market had rallied right after September 9th bottom, people would have accepted this bottom easily. But sideways action over the past week of so with federal Reserves uncertainty really pushed many market participants out of the market.

Next wave would be wave -3 and a sharp rally. Furthermore, market is now entering Vacuum territory.

Vacuum in Nasdaq
After consolidating near all-time highs for almost 2 years, Nasdaq is about to really break out. This break above 16 year highs, puts Nasdaq in unprecedented territory.

Following chart shows that there is Vacuum above this level and could suck the market higher and leave many of the market participants behind.


Believe me its a very difficult thing to buy at all-time highs. And that's why we developed a strategy to align with the trend with proprietary Market Classification Model, in conjunction with tactical allocation and strategic evaluation. This model has performed amazingly well since it's launch on January 1, 2016 (Performance). 

If interested in free e-mail list or in paid services, please fill-out the form below.

Federal Reserves and Market Action

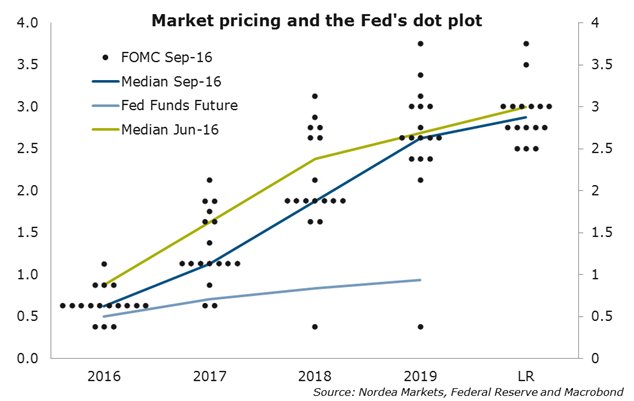
The Fed announced holding the rates and provided guidance for potential increases in future. It wasn't anything out of the ordinary. It was highly unlikely for the fed to raise rates at such time before the elections. However, the more interesting reading came from the dot-plot.

Fed uses this plot to provide guidance regarding future interest rate path. Median of the dots show a curve where Fed officials believe interest rates should be over the next few years.

Following chart shows the plot:


Along with the dot plot, above chart also shows the median projections for the next few years as taken in June and September. As one can see these estimates have come down a lot. As a result, the expectation of interest rise have also decline.

Once this expectation declines, it gives was to higher bond prices and lower yield. At this time, higher bond prices would mean more liquidity, thus being favorable for the overall asset class complex. This situation will surely change one day. For now, we are in an uptrend. In yesterday's analysis on Pre Fed and Bank of Japan announcement, we shared same outcomes

Market Classification Model has been bullish on Bonds for years now. And it seems like there is no reason to bail-out on bonds just yet. Even though many financial gurus have been predicting an inevitable bond demise, which will happen one day, current situation is supportive for a bond rally. As long as trend remains up, forecasts for bond collapse will not come to fruition. Therefore, it's imperative that one remains with the trend.

At Understand, Survive and Thrive, we use Market Classification Model to stay aligned with the trend. MCM is an algorithm based on some of the most time-tested market indicators and their inter-relations to determine when the trend changes, so that we don't stay on the wrong side of the trend for long.

If interested in free e-mail list or in paid services, please fill-out the form below.

Tuesday, September 20, 2016

Strategy Performance

Our proprietary model has been performing very well so far this year. Even with recent 2.5 month sideways consolidation, model is up 22.1% vs 6.3% rise in SP500. We will continue to monitor the performance of this model and share updates. This model will be available for investors to replicate or invest in towards the end of the year.


If interested in free e-mail list or in paid services, please fill-out the form below.

Bank of Japan and Yen

From Bank of Japan perspective, they would like Yen to decline because that was the catalyst to push Nikkei higher couple of years ago. Right now, Commitment Of Trader data (shown below) shows that the market is ripe for another decline in Yen, which means that its likely Japan will reduce interest rates further or introduce some sort of monetary stimulus.


If BoJ stimulates the market and forces a decline in Yen, we can expect a rally in the indices.

If interested in free e-mail list or in paid services, please fill-out the form below.

Pre-Federal Reserves and BoJ Analysis

Sideways Action Continues

This week, so far, has been as uneventful as prior week. Yesterday, markets opened higher but then sold-off towards the end to close slightly negative. Today, markets closed slightly positive. Since last Monday, market has gone net sideways without any major directional move.

Following chart shows that today we closed at the level where we close on Sept 9th, when the world was coming to an end and DJIA had just declined ~4%


Markets are like a coiled spring. And it seems like the entire world is waiting for the Central Banks. Bank of Japan is going to announce its policy statement early in the morning, while Fed announcement will come at 2 PM.


Bank of Japan and Yen

From Bank of Japan perspective, they would like Yen to decline because that was the catalyst to push Nikkei higher couple of years ago. Right now, Commitment Of Trader data (shown below) shows that the market is ripe for another decline in Yen, which means that its likely Japan will reduce interest rates further or introduce some sort of monetary stimulus.


If BoJ stimulates the market and forces a decline in Yen, we can expect a rally in the indices.


Technology getting ready for a Break-Out

While the US markets have been going sideways, Nasdaq has traced out an inverted head and shoulders near all time highs (shown below):

These highs are 16 years old and there is vacuum above this level. If this pattern holds, we can expect a sharp rally in the near future. This rally can start in parallel with central banks announcements or it can start after a decline following Federal Reserves announcement. In any case, this is a very positive development for the market.

If Nasdaq can lead the market, we can be sure that the overall market will follow and that the recession talk will substantially subside. According to Market Classification Model, we remain in an uptrend. Uptrend typically results in rallies and market participants find reasons to be bullish even in front of negative news.


Strategy Performance

Our proprietary model has been performing very well so far this year. Even with recent 2.5 month sideways consolidation, model is up 22.1% vs 6.3% rise in SP500. We will continue to monitor the performance of this model and share updates. This model will be available for investors to replicate or invest in towards the end of the year.


If interested in free e-mail list or in paid services, please fill-out the form below.


Monday, September 19, 2016

Market Review and Next Week

After a sharp decline on September 9th where Dow dropped almost 400 points, market went sideways last week. Although the net result was sideways action, extreme marker moves were witnessed. Monday opened negative and then markets rallied hard, while Tuesday saw a sharp sell-off.

As the week came to a close, the volatility and market range had reduced. In fact, market closed +0.5% for the week. Following chart shows gyrating market behavior of last week.


While SP500 and DJIA consolidated towards the bottom of the range, Nasdaq 100 powered to near all-time highs, primarily driven by Apple stock and the demand for the new iphone and Samsung issues. QQQ are now very close to all-time highs!


One thing that we have said many times on this blog is that the market trend determines how the market participants and investors react to headlines. This weekend there were many reasons to sell the market, ranging from bomb blast in NYC to other events in Syria (US and Russia tension). However, if we are in an uptrend all headlines will be interpreted in a positive manner and resolve to the upside.

According to Market Classification Model, stocks remain in an uptrend. And that's the reason why we have neither sold our stock positions nor are planning to sell them till the model turn south. At this point, it will take a sustained substantial decline to do so. However, past week's decline has created enough selling extreme without really damaging the internal structure, that one can treat it as a minor correction in an uptrend.

Next Week
In the coming week, there are many reasons stories that could move the market. Top two news events will be:

  1. Fed FOMC meeting
  2. Bank of Japan meeting
It's very interesting that Fed and BOJ announcements will come one day before Fall Equinox on Sept 22nd. 

Investment Actions
Staying long in stocks and ignoring news based market gyrations would be two of the most important things one can do. If the market declines, it will provide an even better buying opportunity. But it's possible that the market rallies for next 1-2 days, followed by a decline after Fed announcement, which is quickly reversed. 

In other words, there will be a lot of back and forth, and one should not get caught in such gyrations. Instead, its paramount to remain focused becaus ethat's how you can become successful in the long-term.

If interested in free e-mail list or in paid services, please fill-out the form below.

Thursday, September 15, 2016

Interesting 5 days in Stock Market

Today's sharp rally wraps up an amazing 5 day period in the markets. Today, Nasdaq 100 closed within 0.4% of all-time highs. It feels like a stealth rally, especially at a time when the entire financial media started proclaiming end of the bull market or a sharp decline, after last Friday's decline.


It has been a period through which we can learn a lot of investment lessons and become better traders. For Example:


  1. Do not panic and stay with the trend
  2. Market will continue to deliver sharp declines in a bull-market and sharp rallies in bear markets to push market participants on the sidelines or in the wrong direction
  3. Always remain aligned with the direction of the trend, no matter what the headlines are

How it started!
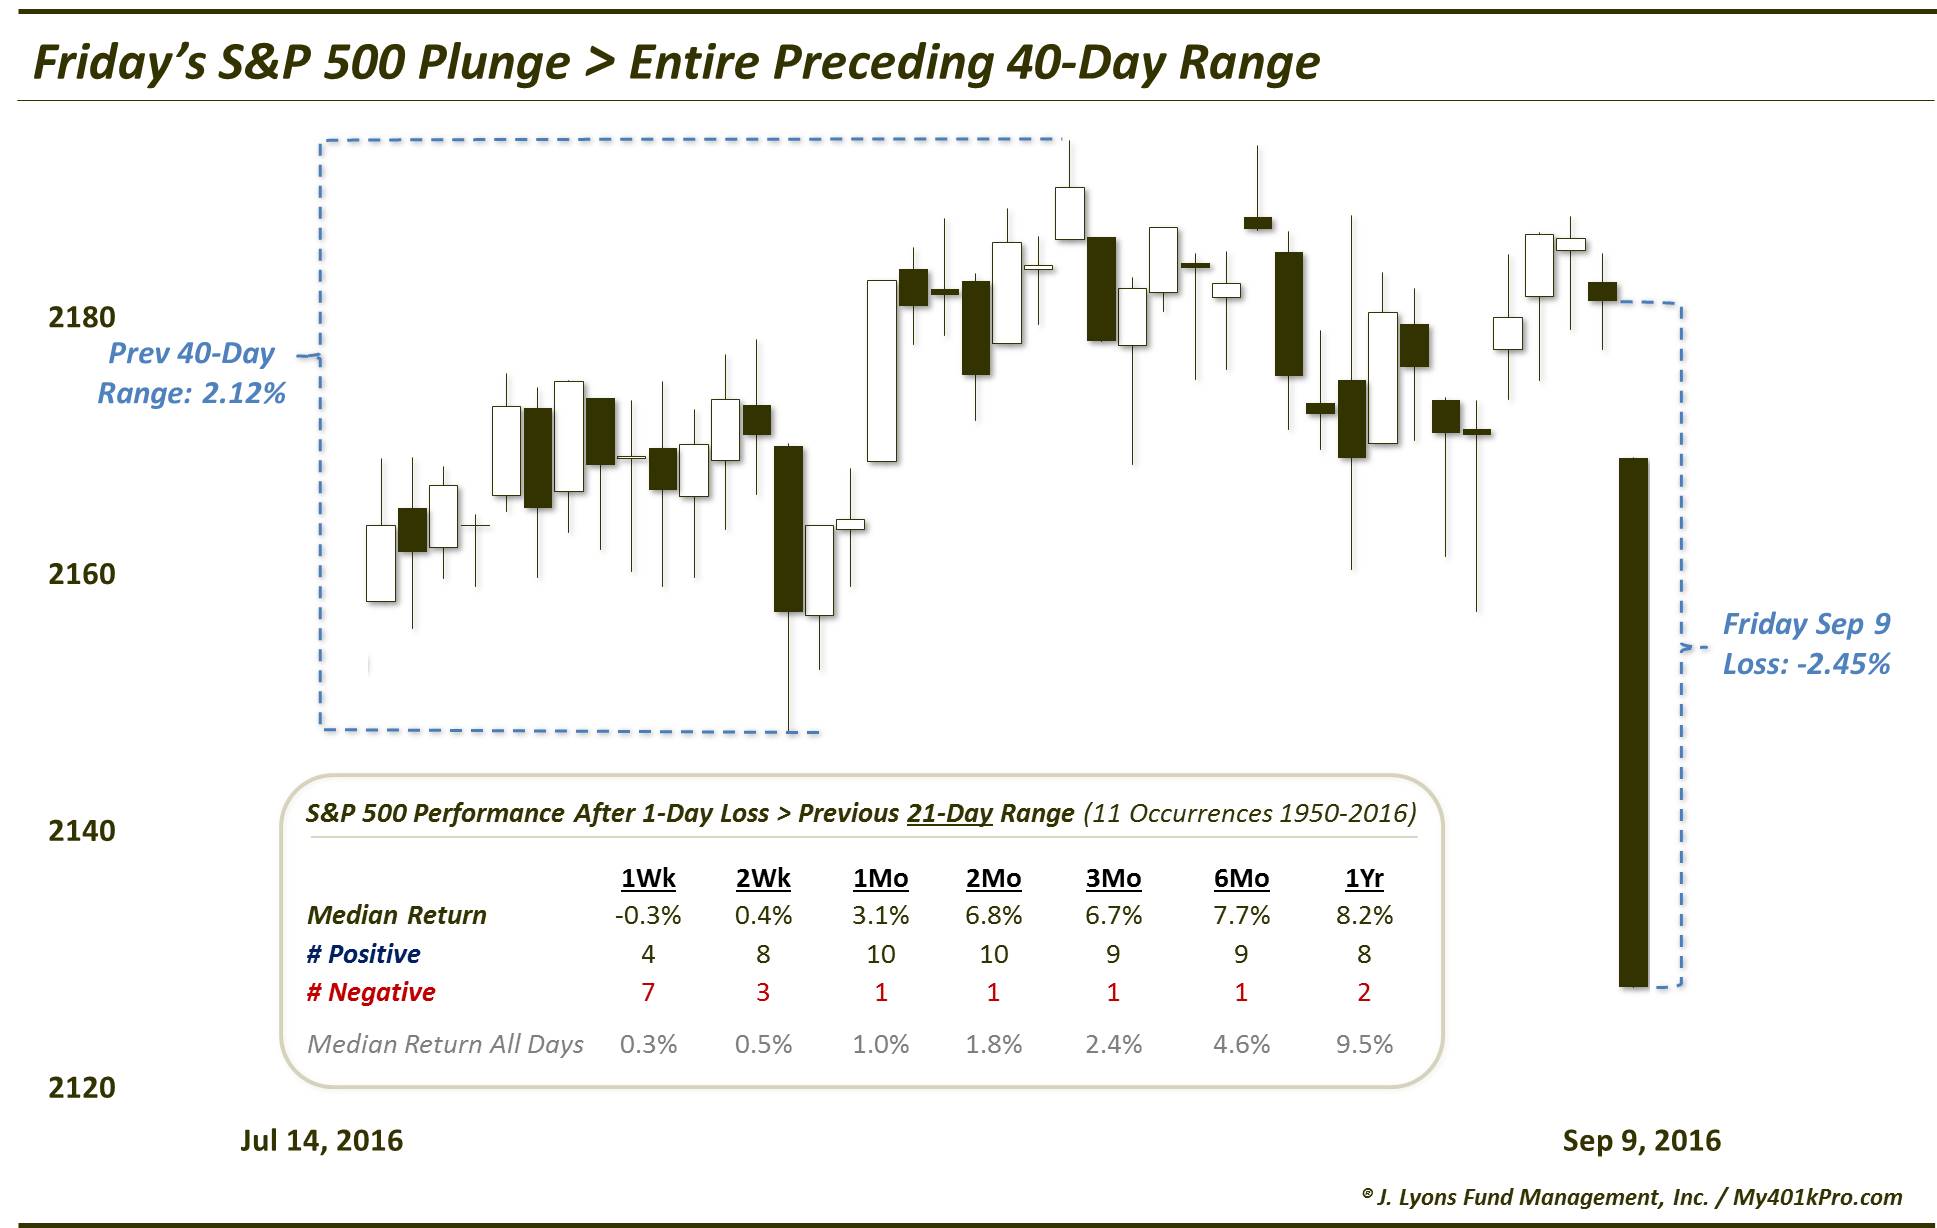
Last 5 days have been nothing short of amazing for the markets. On Friday, September 9, markets declined substantially. The decline was so significant that trading range of 40 days was covered in one trading session.


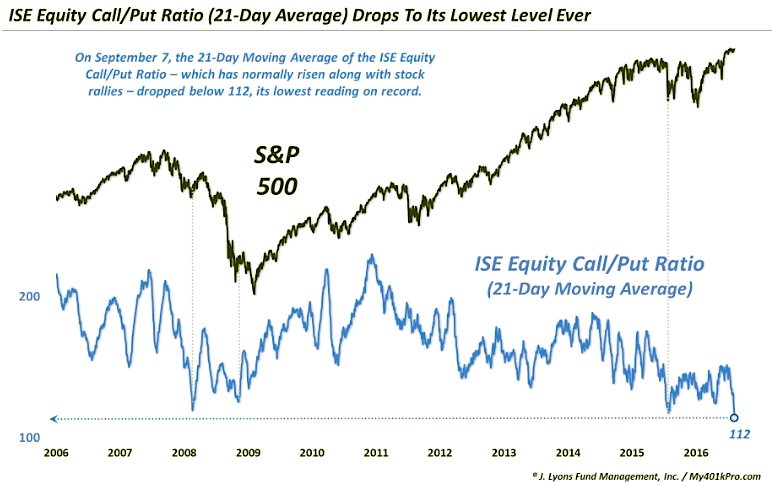
This decline was quite a departure from the dog days of Summer, where market set a record in reduced volatility. By some measures, the volatility was lowest in history. (Charts courtesy of Dana Lyons)


Although many knew that this kind of action is unsustainable, the decline that followed took many by surprise. While everyone was talking about a decline and even we were expecting a decline to shake-out the loose hands, most amusing part was the justification for this decline.


You could see reasons from Fed to emerging markets unwinding, and from valuations to sentiment based complacency. Although all of these reasons are very valid reasons, one needs to thing about these in the context of the market.

Market Trend
According to Market Classification Matrix, a proprietary indicator that uses internal strength indicators that tell us about the strength of the market, we were in a uptrend. And therefore, instead of selling or panicking, we stayed long and kept our cool. No longs were exited.

Our proprietary trading model kept it's long positions. And as September 9th progressed, we realized that this sell-off was generating several buy signals. We will discuss some of the buy signals and the reasons why we think we are just starting the next rally phase, in the next posts. Even though the decline did not result in an immediate bottom for major indices, we saw a sharp rally on Monday after morning decline, which was followed by another two declines on Tuesday and Wednesday.

But the bottom line is that many people panicked while trend remained up. There were very few people who took advantage of the market when it was declining.


Wednesday, August 24, 2016

Gold Movement

Gold experienced a sharp decline today, while Gold Stocks were massacred with a 7% decline in one day. This kind of price action was very important to remove the excessive optimism that had plagued the Gold market.

Since early July, Gold has been consolidating sideways. Following chart shows a potential pattern being traced out by Gold.


Gold price action appears to be corrective in nature i.e. first decline was followed by a triangle formation. Triangle has recently broken to the downside. Minimum target of this pattern will be a decline below 1310. We think that over the next few days, gold will bottom around ~1300 and then it can resume its trend. This level signifinies Fibonacci ratios and support line.

This decline will also bring back the bears and force many weak longs to get out of the market, just before the next rally phase, according to Market Classification Model.


A proprietary algorithm that classifies market conditions i.e. Bull market or Bear market. Currently, this model is suggesting a longer-term up-trend for the US Stock Market. For Subscription click below:

Tuesday, August 23, 2016

Portfolio Performance - August 23, 2016

Last few weeks have been extremely slow for the market, and also for our proprietary portfolio. Following chart shows the performance of SP500 in relationship with our portfolio.


Some of the key observations are:
  1. SP500 (total return) is up +0.62% MTD, while portfolio is down -0.5% for the same period
  2. Model has been consolidating in a very tight range, which means a break is coming
  3. SP500 is also stuck in a very tight range with a slight upwards tilt
  4. Historically, model's performance has been uncorrelated to the market with upwards bias. If this continues, we should expect a break-out in the near future

Portfolio Overview
At a time when stock market has not performed well, and has caused a lot of anxiety among investors, our prop investing strategy has out performed the market in all aspects:
  • Volatility - Historical testing shows that model has 8% standard deviation vs 16% for SP500
  • Sharpe Ratio - Historically, model has a sharp ratio 2.5+
  • Beta - Current weighted average Beta based on portfolio components is 0.32
And above all, model is positioned to take advantage of the next market move. Therefore, it enables one to relax and invest with confidence. 


Market Action and upcoming events
There are genuine reasons for current market calm e.g. August is a slow month and also people are awaiting Fed action. By some measures optimism among investors has reached levels where it has resulted in market declines. We think that market structure, IPM turn window and extreme in sentiments will give way to a sharper decline in the stock market after Labor day, once people return from vacation.

However, it won't be a reason to sell the market. The time to sell is now, if you want to. That will be time to buy because the trend remains up. Following the bull market is one of the most critical things an investor must do. Staying long in a bull market pays dividends in the long-term. At UST, we stay aligned with the trend by following our proprietary Market Classification Model

A proprietary algorithm that classifies market conditions i.e. Bull market or Bear market. Currently, this model is suggesting a longer-term up-trend for the US Stock Market. For Subscription click below:

Thursday, August 18, 2016

Inflection Point Model - August Turn Date

Market's decline over the past few days probably culminated at today's Fed meetings minutes. Although there was nothing significant in the minutes, underlying uptrend of the stock market is taking the lead. 

There are several ways, technical and non-technical, in which one can justify either direction of the market i.e. up or down. But in any case, according to our proprietary market timing model, the next turn window is scheduled for Aug 30, 2016 (+/- 4 days).


Although the turn date signifies a major market inflection point with the direction, different market indicators suggest that current rally will continue till the end of August. End of August turn window will most likely be a short-term market top. 

This also means that next week's Federal Reserves Jackson Hole meeting would also propel the stock market. We will will discuss other indicators in the next posts. But the key thing to keep in mind is that no matter what anybody says about the market, the path of least resistance is always with the trend.

Currently, according to proprietary Market Classification Model, the stock market is in an uptrend. This model took us out of the stock market in September 2015 and kept us out of the stocks till June 2016. As a result, we avoided the sharp market gyrations, while investing in better performing areas. 


Friday, June 24, 2016

Brexit and its Social and Economical Impacts!!!

Finally, the United Kingdom has spoken. They want to get out of the European Union - first country to ever leave the EU experiment. Although the EU experiment had a lot of promise, it turned sour when wealthy countries had to bail-out others. While leaders were open to the idea, public clearly opposed it.

Flow of Events going forward:

  1. UK's exit will now call more countries to hold REFERENDUMS
  2. EU might be even more FRACTURED 
  3. TRADE will slow down
  4. Bad for the EU and consequently the GLOBAL ECONOMY 
  5. Poor economy will impact the STOCK MARKET
  6. Force central banks to infuse more liquidity into the system and hence, keeping the INTEREST RATES LOWER for an extended period of time.

All of this can be summarized into:

  • Stocks --> Lower
  • Bonds --> Higher
  • Gold --> Higher
I wish this was one of those Black Swan events, which brought in panic selling and then markets continued on their merry way. However, our Stock Market Bear Case analysis shows that the trend is about to turn lower. We have been out of stocks since last August (2015), with short allocation in Jan, Feb and March.

Now nothing goes straight down. So its possible that after 2-3 days of panic selling, we might see a relief rally into Q2 earnings. But earnings and all the estimates will be adjusted due to Brexit vote and hence, markets will have a lot of reasons to decline. We will keep evaluating the developing market conditions and share insights.

Under these circumstances, we are keeping our strategic allocation in the portfolio (YTD results till last week). Will share latest results over the weekend. The portfolio is totally uncorrelated to the stock market, and as a result gives a lot of peace of mind, at time of market turbulence.

In the next post, we will discuss impact of Brexit on our social and retirement investing.


Friday, January 15, 2016

Bonds Bull is Roaring

We have been discussing stock market's #Bear and Bond market's #Bull for a while. Now it seems like Bond market is really taking-off. This is evident from a sharp rally in the bonds over the last 2 weeks. Some might attribute it to the declining stock market but a bull market keeps on rising and people find reasons for the rise.

As a confirmation of the trend, bond prices have just completed an inverted Head and Shoulders pattern (shown below):


We have been discussing this pattern since December, as following charts was published here on December 21.


As bonds rally and stocks decline, we are short stocks and long bonds. Being long bonds gives us cash flow in form of dividends and being short stocks allows us to take advantage of the downside.

Like any market, this bond rally will come across obstacles but the constant cash flow and the diversification provided by this investment is invaluable, along with the potential for capital gains. At the same time, it will provide a very good opportunity and probably the last opportunity for people to buy homes at very low interest rates.

As market gets more volatile, it will even make more sense to invest in bonds. But the good time to invest in any asset class or stock is before the major move happens and the news becomes public. Let's see when the stock market bounce happens, which might provide added insight into the long-term (6 months to 1 year) market trajectory.

After all is said and done, there will be a very good opportunity to buy stocks down the road.


Wednesday, January 13, 2016

Nasdaq Head and Shoulders Completed

Market is declining and Head and Shoulders have played out exactly in Nasdaq. We are in a #bear and we have been discussing this scenario since August 2015. 
 
Following chart was presented on January 4, 2016 (link).


Market so far has played out Head and Shoulders pattern to the target, as shown below.


Head and Shoulders patterns are forming in many other asset classes. We will review these in the next few blog posts.

Wednesday, January 6, 2016

Long Term View of Dow Jones Industrial - $DJIA

Markets continued their decline and are again poised for a down day with China closing early due to circuit breakers being activated for the day.

We have been talking about the stock market trend change since September 2015 in the following blog posts:
  1. New Year and the Stock Market
  2. Bonds Rally Analysis and Stocks
  3. Importance of objectivity in trend following
  4. Current Market - Bear Case Evaluation
  5. Investment Optimization Model (IOM) Performance - August 2015

At the same time we have been discussing markets via twitter on a more frequent basis. In this post, I would like to analyze the market from a long-term perspective. Chart below shows the performance of Dow Jones Industrial Average over the past 2 decades. 


Following are the key highlights evident from the above chart:

  1. US stock market remained in a sideways phase for over a decade
  2. US stock market broke above the resistance level in 2012. This break was more pronounced in SP500
  3. Rounding top/Head and Shoulders top formations took place at the two prior tops. And currently, it seems like a similar pattern is being formed
  4. There is a longer-term trend line which the market failed to break to the upside, and might have capped this bull-market
  5. Since the economy lags the stock market by ~6 months, we can start seeing the impact of lower oil prices through energy sector decline in the economy, starting in Q3'16
  6. If the market has really topped, we can expect ~7+ months of decline to correct last ~7 years of rally (if we are not in a secular bear market)
  7. Decline in earnings will result in higher P/E ratio. As a result, stock prices might come down to bring the P/E ratio to normal or lower valuations
  8. Many of the individuals components of $DJIA are tracing out individual Head and Shoulder patterns, which could mean that the market's components are broken
  9. Best case scenario for this correction would be to end before breaching below 2011 lows
  10. Worst case scenario would be a break below 2009 lows and formation of an expanded traingle pattern, similar to 1970s bear market but a larger scale
In short, current market decline should be looked at with caution. Until and unless the model confirms a bull market, we will not enter long. Algorithm has been long bonds for a while and went short on stocks on Jan 1st. Aggressive portfolio is long other assets based on proprietary asset allocation mechanism.

At UST we have now dealt with short-term trading based on IPM trading model and longer-term investment based on Investment Optimization Model. We will continue to share our insights with readers. For now be careful. We will go long, as soon as the model goes long.


Monday, January 4, 2016

New Year and the Stock Market

Happy New Year. Although today is the first trading day of the year, markets opened at negative 300. From a such a negative opening its very hard to make a come back and close in the positive territory. And market declines on the first day of the year, odds of a losing year are at 50% based on historical data (link).  

At Understand, Survive and Thrive, we suggested that the market has undergone a trend change back in September (link).  However, we suggested that shorting opportunity is not here, and we should wait for a market rally. Experience shows that markets rally after a sharp decline for two reasons:

  1. To entice weak hands into the market as buying opportunity
  2. To shake shorts who were early to the game
Once the mood changes, markets start their decline phase, which is persistent. At this point, the possibility of a prolonged decline has increased sharply. In fact, several of the high fliers like MSFT, NetFlix and others are down big today, which shows that the leadership is now leaving the market.

This is also evident from the structural integrity of the market. Stock market patterns can provide very valuable insights into the performance of a particular stock or the over all market. We discussed in December (link) that the market is tracing out a Head and Shoulders pattern, which symbolizes potential trend changes. That pattern is still in plan. But now another Head and Shoulders pattern is visible in Nasdaq (shown below).


Once this pattern is completed, which is almost complete, we can see a sharp sell-off to the downside. This could take the prices down to prior base level i.e. potential 6%+ decline from current levels.

One might ask what can cause such a decline. Although there are many reasons that we will read in the news for today's decline, earnings will be the primary driver, which start in 2 weeks. As economy weakens, earnings will dwindle and stock market will follow. So in the situation what an investor must do?

Following are some of the strategies that we are applying to navigate through this situations:
  1. Invest in assets that are in bull markets (Bonds)
  2. Exit longs from stocks
  3. Short indexed ETFs with predefined mix of diversified assets and risk mitigation startegies
  4. Keep powder dry for upcoming bull markets in other asset classes
 

Wednesday, February 5, 2014

Markets Overview and Further Decline Possible

Yesterday's sideways action flows very nicely with the wave 4 argument. Wave 4s give way to wave 5. Therefore, we should expect another down draft in the very near future. Following chart shows the updated market structure.


In order for this structure to remain valid, market should stay below 1770. Once we break below recent lows and enter the 1730 area, we will near the end of Wave 3 of a higher degree. SP500 target levels is between 1722 and 1730.

This 5-wave completion could have two possibilities:

  1. Immediate sharp rally
  2. Immediate rally but more of a sideways market action, followed by another low
  • Scenario 1 would mean that markets will likely rally to new all-time highs.
  • Scenario 2 would mean that markets have entered a downtrend and one should be careful of rallies. 
From a Market Matrix perspective, it seems like market wants to decline to lower levels and this decline is not over yet. Sentiment is also not showing pessimistic extremes. Above all, one should wait for the IPM Turn Window to pick the bottom. Therefore, we will keep on analyzing the market for further clues and see how things evolve. This analysis will help us in next IPM Trade Matrix trade.

Please note that latest IPM Trade Matrix trades have been updated on the blog at: 

IPM Trade Matrix - Trade 4 (Part 3)


Tuesday, February 4, 2014

IPM Trade Matrix - Trade 4 (Part 3)

IPM Trade Matrix Trades

TRADE - 1: (Long) = +2.6%
TRADE - 2: (Short) = +9.3%
TRADE - 3: (Long) - Non IPM Trade Matrix trade = -0.2%

TRADE - 4: Short - Still holding short since 1/31/14
Long TZA (short ETF) at 18.23 ==> 18.57 (shorts added) 
Short positions were added on 1/31/14, 2/3/14 and 2/4/14 based on Elliott Wave structure and break below critical levels. 

TRADE CONDITIONS
Condition: Outside IPM Turn Window (Re-entry)
Trigger: Test of ~1785 (SP500) and decline below 1769 (SP500). Decline trigger was based on EW analysis and other proprietary levels. 
Supporting Indicators:  Initial decline was impulsive (5-wave). Next IPM window is a Bottom and is 1-2 weeks away. Details of IPM turn window e-mailed to subscribers. 

PROFIT TARGETS
Profit Target 1: 1725 - 1730
Profit Target 2: 1670 

RISK
Stop: Above 1770
Trailing Stops: 1770 - Based on Elliott Wave analysis (will be updated on a regular basis)
Typical IPM Trade Matrix Risk: 1.5%
Actual IPM Trade Matrix Risk: 0% (Entry = 1785, Exit = 1770, Risk = No Risk)
Risk Reason: No significant risk because upcoming turn date is a bottom.

Applicable Rule: Do not go long or short without trigger to prevent losses by market moving against you.  


Note: IPM Trade Matrix Trades will be posted in the first half of 2014. This is an experiment to understand and enhance the capabilities of this Matrix.