Twitter

Showing posts with label Nasdaq. Show all posts

Wednesday, November 2, 2016

Market Trend Remains Up

Sideways consolidation continued over the last week. The blog wasn't updated because of registration paperwork. We will discuss Investment Advisory registration in one of the upcoming posts.

Markets' sideways action remains intact. Even though in the last couple of days SP500 and US indices saw a relatively sharp decline, it did not impact the overall shape and form of the market.

Market Structure
SP500 is tracing out a diagonal pattern (shown below). One of the criteria of this pattern was to decline below C level, which it did yesterday. Now, the market needs to hold above yesterday's bottom to confirm that this pattern has been completed.


The overall market structure remains very choppy. This choppy action now spans over 4 months, which is a good enough time to correct the market through time. At weekly level this sideways action looks nothing more than a bull flag or pennant formation. And both of these are bullish in nature.


In terms of next market move, there are couple of options and will be determined by how the market participants react to the next rally phase. In either case, the minimum rally requirements would be above July 2016 high or around that level (SP500 = 2190).

Sentiment
Recent decline has also improve sentiment measures to suggest that a more sustainable rally is possible.

Fear/Greed indicator is at levels where it typically signifies a market bottom.

Similar another indicator just generated a buy signal and could mean that the trend is about to turn to the upside.


Market Classification Model:
MCM for stocks continues to be in a bull market. Therefore, the trend remains up and we will soon see a sharp rally. Even with yesterday's sharp decline, our strategy performed well. While SP500 was down 0.72%, we were up 0.20%. Another proprietary model is suggesting a sharp rally in our strategic allocation portfolio. We will see. So far by the grace of almighty, our proprietary portfolio is up ~20% YTD (after 10 months), which SP500 is up ~6%.

 If interested in free e-mail list or in paid services, please fill-out the form below.


Tuesday, October 25, 2016

Inflection Point Model - Performance Recap

Inflection Point Model predicted a market turn date on Oct 21, 2016. Market declined on the 21st and then rallied. The rally continued today and futures are up now. With new catalyst along the way in the form of earnings from Apple and Google, we can expect more gains. Good thing is that even with today's very powerful rally, there was no sell signal. This suggests that the trend remains intact and is strong.

IPM Output - Turn date 10/21/16
Following chart shows the IPM model's output, as shared on Oct 17th (link)
Market Structure
Analyzing IPM model in conjunction with the market structure showed us that the trend had been sideways to down since mid July. Hence, the likely scenario was for market to put in a bottom during the IPM turn window and rally.

Following chart shows the latest structure shared on the blog along with a blue box, highlighting potential market turn window.


Following chart shows performance of SP500 as of today i.e. after bottoming within IPM turn window on Oct 21, one can observe the green bar with a gap up. Today's performance shows that the market gaped-up but did not cover the gap, hence, hinting towards a strong move. At the same time, confusing so many market participants, who have been taking failure of rallies as the new norm. 


Next Steps
We will continue to evaluate the market with respect to its structure and Inflection Point Model. One of the biggest benefits of the IPM model is to forecast potential market turn dates. And when IPM turn dates are combined with Market Classification Modal, it paints a much clearer picture. 

Market Classification Model is bullish. Next run of the model will be in next few days. Once the model is processed, it will tell us whether the internal strength of the market justifies a continued bullish posture or should one be wary of market trend changes. This information will be shared with subscribers immediately, so that they may evaluate their long investment positions.

Tomorrow's market Action
So far the futures are up and we could see a  continuation of the rally. This rally has a lot going for it but there are some signs of tiredness appearing in the market. We will evaluate the market structure and next IPM turn window in upcoming posts.

If interested in free e-mail list or in paid services, please fill-out the form below.

Thursday, September 22, 2016

Correction Complete - Approaching Vacuum

Near term market structure suggests that market has just completed a correction. With intermediate trend up and recent sell-off triggering several buy signals, it seems like we are on the cusp of a major rally.

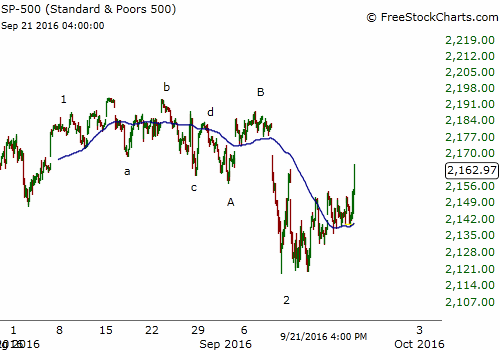
Following chart shows the correction count, since early August.


Since August 8th markets have gone sideways. This sideways action culminated on 9/9 with 400 point decline in DJIA. If the market had rallied right after September 9th bottom, people would have accepted this bottom easily. But sideways action over the past week of so with federal Reserves uncertainty really pushed many market participants out of the market.

Next wave would be wave -3 and a sharp rally. Furthermore, market is now entering Vacuum territory.

Vacuum in Nasdaq
After consolidating near all-time highs for almost 2 years, Nasdaq is about to really break out. This break above 16 year highs, puts Nasdaq in unprecedented territory.

Following chart shows that there is Vacuum above this level and could suck the market higher and leave many of the market participants behind.


Believe me its a very difficult thing to buy at all-time highs. And that's why we developed a strategy to align with the trend with proprietary Market Classification Model, in conjunction with tactical allocation and strategic evaluation. This model has performed amazingly well since it's launch on January 1, 2016 (Performance). 

If interested in free e-mail list or in paid services, please fill-out the form below.


Federal Reserves and Market Action

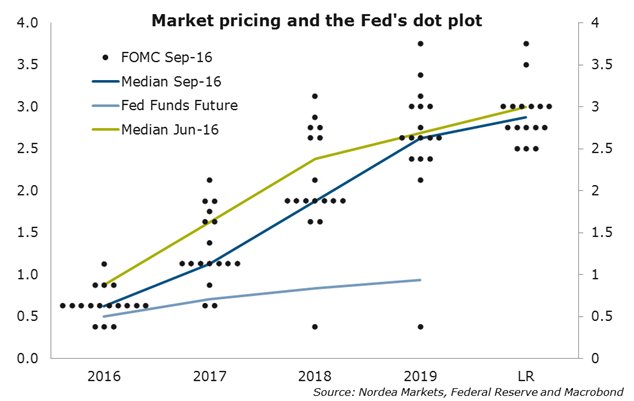
The Fed announced holding the rates and provided guidance for potential increases in future. It wasn't anything out of the ordinary. It was highly unlikely for the fed to raise rates at such time before the elections. However, the more interesting reading came from the dot-plot.

Fed uses this plot to provide guidance regarding future interest rate path. Median of the dots show a curve where Fed officials believe interest rates should be over the next few years.

Following chart shows the plot:


Along with the dot plot, above chart also shows the median projections for the next few years as taken in June and September. As one can see these estimates have come down a lot. As a result, the expectation of interest rise have also decline.

Once this expectation declines, it gives was to higher bond prices and lower yield. At this time, higher bond prices would mean more liquidity, thus being favorable for the overall asset class complex. This situation will surely change one day. For now, we are in an uptrend. In yesterday's analysis on Pre Fed and Bank of Japan announcement, we shared same outcomes

Market Classification Model has been bullish on Bonds for years now. And it seems like there is no reason to bail-out on bonds just yet. Even though many financial gurus have been predicting an inevitable bond demise, which will happen one day, current situation is supportive for a bond rally. As long as trend remains up, forecasts for bond collapse will not come to fruition. Therefore, it's imperative that one remains with the trend.

At Understand, Survive and Thrive, we use Market Classification Model to stay aligned with the trend. MCM is an algorithm based on some of the most time-tested market indicators and their inter-relations to determine when the trend changes, so that we don't stay on the wrong side of the trend for long.

If interested in free e-mail list or in paid services, please fill-out the form below.

Tuesday, September 20, 2016

Technology getting ready for a Break-Out

While the US markets have been going sideways, Nasdaq has traced out an inverted head and shoulders near all time highs (shown below):

These highs are 16 years old and there is vacuum above this level. If this pattern holds, we can expect a sharp rally in the near future. This rally can start in parallel with central banks announcements or it can start after a decline following Federal Reserves announcement. In any case, this is a very positive development for the market.

If Nasdaq can lead the market, we can be sure that the overall market will follow and that the recession talk will substantially subside. According to Market Classification Model, we remain in an uptrend. Uptrend typically results in rallies and market participants find reasons to be bullish even in front of negative news.

If interested in free e-mail list or in paid services, please fill-out the form below.


Pre-Federal Reserves and BoJ Analysis

Sideways Action Continues

This week, so far, has been as uneventful as prior week. Yesterday, markets opened higher but then sold-off towards the end to close slightly negative. Today, markets closed slightly positive. Since last Monday, market has gone net sideways without any major directional move.

Following chart shows that today we closed at the level where we close on Sept 9th, when the world was coming to an end and DJIA had just declined ~4%


Markets are like a coiled spring. And it seems like the entire world is waiting for the Central Banks. Bank of Japan is going to announce its policy statement early in the morning, while Fed announcement will come at 2 PM.


Bank of Japan and Yen

From Bank of Japan perspective, they would like Yen to decline because that was the catalyst to push Nikkei higher couple of years ago. Right now, Commitment Of Trader data (shown below) shows that the market is ripe for another decline in Yen, which means that its likely Japan will reduce interest rates further or introduce some sort of monetary stimulus.


If BoJ stimulates the market and forces a decline in Yen, we can expect a rally in the indices.


Technology getting ready for a Break-Out

While the US markets have been going sideways, Nasdaq has traced out an inverted head and shoulders near all time highs (shown below):

These highs are 16 years old and there is vacuum above this level. If this pattern holds, we can expect a sharp rally in the near future. This rally can start in parallel with central banks announcements or it can start after a decline following Federal Reserves announcement. In any case, this is a very positive development for the market.

If Nasdaq can lead the market, we can be sure that the overall market will follow and that the recession talk will substantially subside. According to Market Classification Model, we remain in an uptrend. Uptrend typically results in rallies and market participants find reasons to be bullish even in front of negative news.


Strategy Performance

Our proprietary model has been performing very well so far this year. Even with recent 2.5 month sideways consolidation, model is up 22.1% vs 6.3% rise in SP500. We will continue to monitor the performance of this model and share updates. This model will be available for investors to replicate or invest in towards the end of the year.


If interested in free e-mail list or in paid services, please fill-out the form below.


Monday, September 19, 2016

Market Review and Next Week

After a sharp decline on September 9th where Dow dropped almost 400 points, market went sideways last week. Although the net result was sideways action, extreme marker moves were witnessed. Monday opened negative and then markets rallied hard, while Tuesday saw a sharp sell-off.

As the week came to a close, the volatility and market range had reduced. In fact, market closed +0.5% for the week. Following chart shows gyrating market behavior of last week.


While SP500 and DJIA consolidated towards the bottom of the range, Nasdaq 100 powered to near all-time highs, primarily driven by Apple stock and the demand for the new iphone and Samsung issues. QQQ are now very close to all-time highs!


One thing that we have said many times on this blog is that the market trend determines how the market participants and investors react to headlines. This weekend there were many reasons to sell the market, ranging from bomb blast in NYC to other events in Syria (US and Russia tension). However, if we are in an uptrend all headlines will be interpreted in a positive manner and resolve to the upside.

According to Market Classification Model, stocks remain in an uptrend. And that's the reason why we have neither sold our stock positions nor are planning to sell them till the model turn south. At this point, it will take a sustained substantial decline to do so. However, past week's decline has created enough selling extreme without really damaging the internal structure, that one can treat it as a minor correction in an uptrend.

Next Week
In the coming week, there are many reasons stories that could move the market. Top two news events will be:

  1. Fed FOMC meeting
  2. Bank of Japan meeting
It's very interesting that Fed and BOJ announcements will come one day before Fall Equinox on Sept 22nd. 

Investment Actions
Staying long in stocks and ignoring news based market gyrations would be two of the most important things one can do. If the market declines, it will provide an even better buying opportunity. But it's possible that the market rallies for next 1-2 days, followed by a decline after Fed announcement, which is quickly reversed. 

In other words, there will be a lot of back and forth, and one should not get caught in such gyrations. Instead, its paramount to remain focused becaus ethat's how you can become successful in the long-term.

If interested in free e-mail list or in paid services, please fill-out the form below.

Thursday, September 15, 2016

Interesting 5 days in Stock Market

Today's sharp rally wraps up an amazing 5 day period in the markets. Today, Nasdaq 100 closed within 0.4% of all-time highs. It feels like a stealth rally, especially at a time when the entire financial media started proclaiming end of the bull market or a sharp decline, after last Friday's decline.


It has been a period through which we can learn a lot of investment lessons and become better traders. For Example:


  1. Do not panic and stay with the trend
  2. Market will continue to deliver sharp declines in a bull-market and sharp rallies in bear markets to push market participants on the sidelines or in the wrong direction
  3. Always remain aligned with the direction of the trend, no matter what the headlines are

How it started!
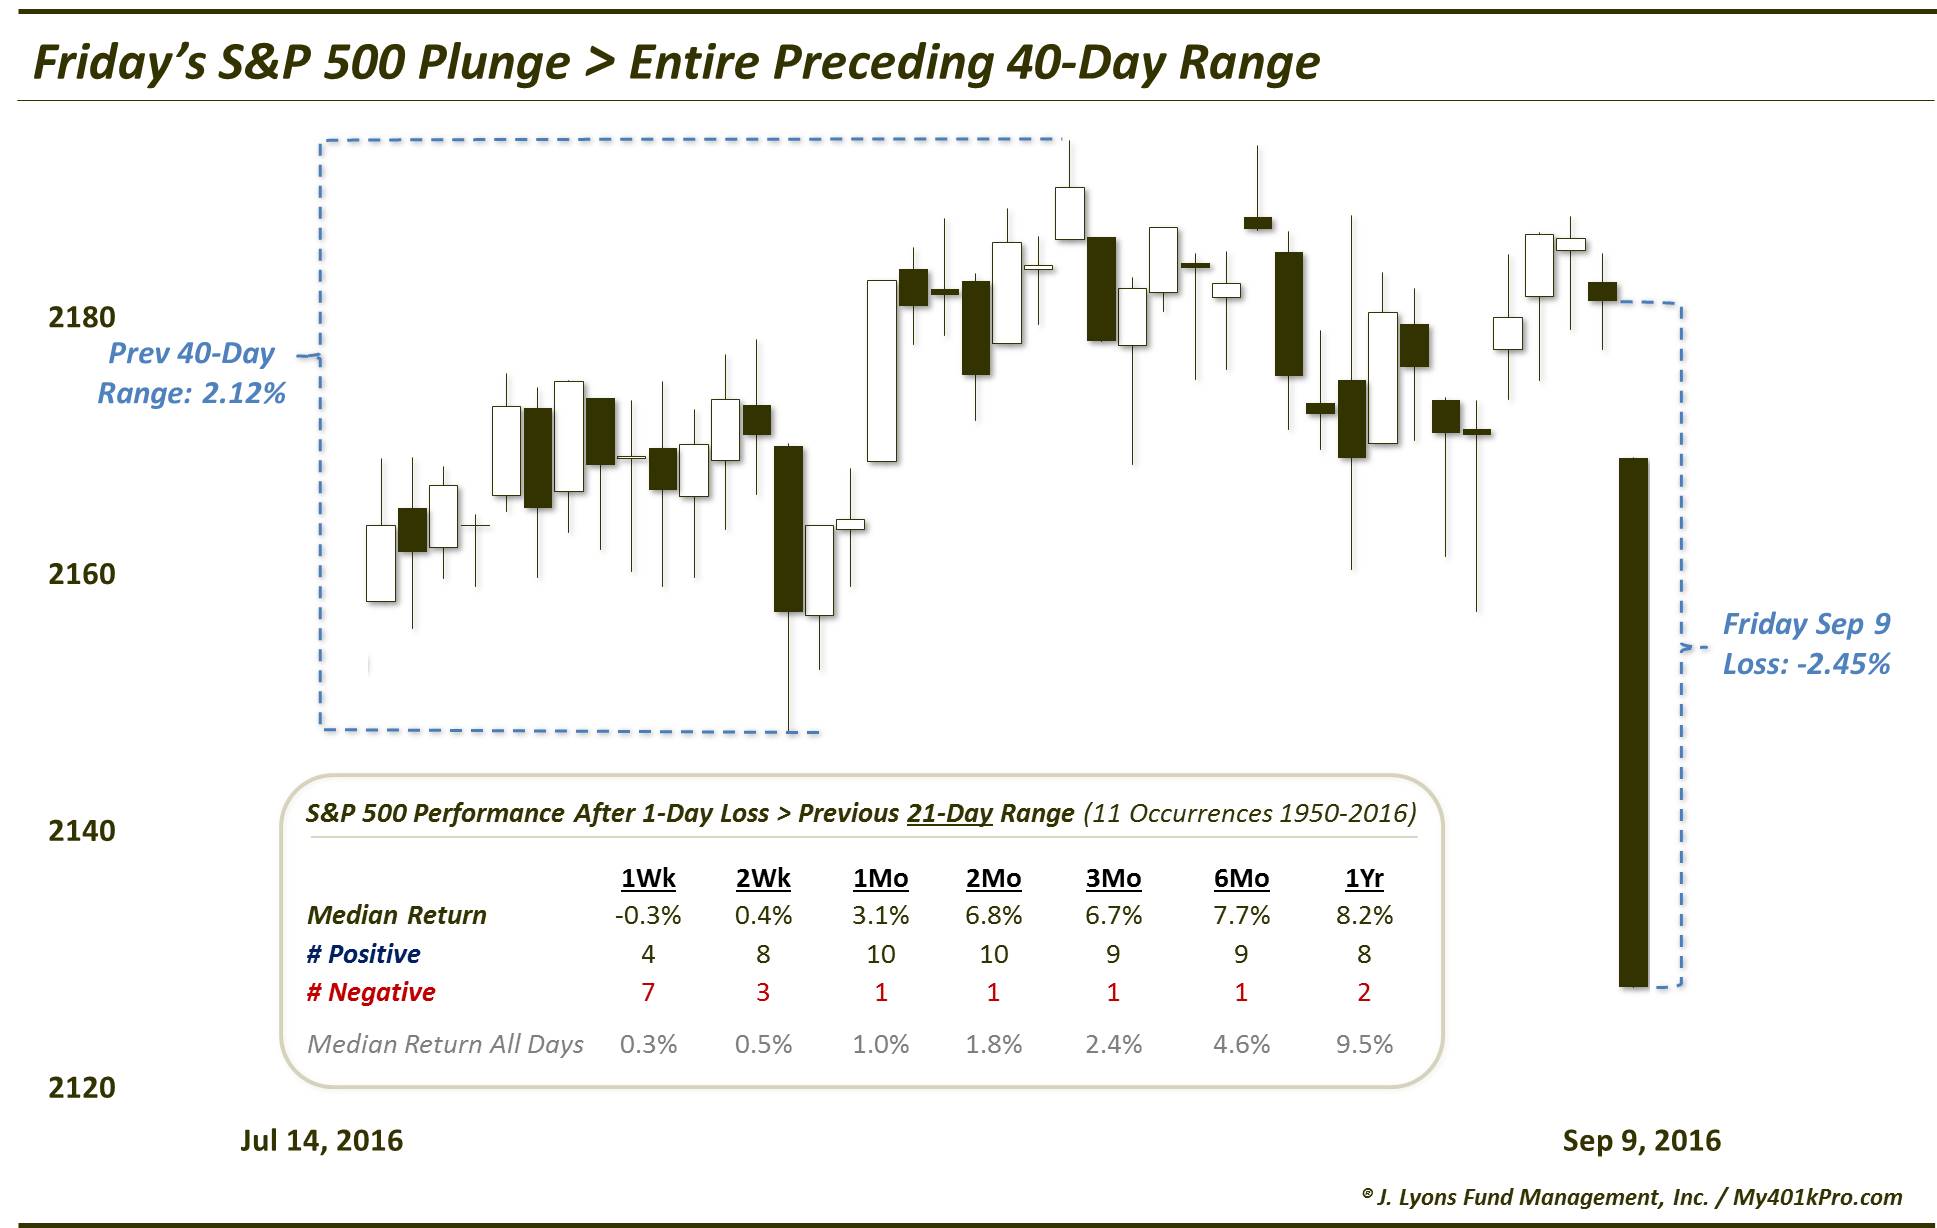
Last 5 days have been nothing short of amazing for the markets. On Friday, September 9, markets declined substantially. The decline was so significant that trading range of 40 days was covered in one trading session.


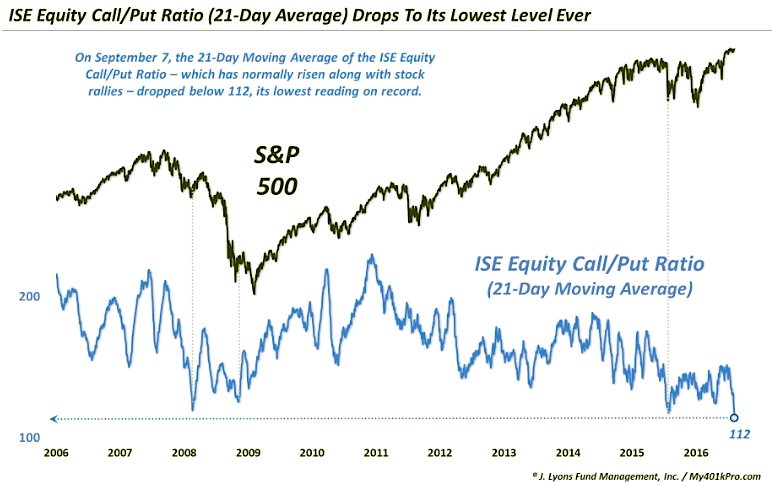
This decline was quite a departure from the dog days of Summer, where market set a record in reduced volatility. By some measures, the volatility was lowest in history. (Charts courtesy of Dana Lyons)


Although many knew that this kind of action is unsustainable, the decline that followed took many by surprise. While everyone was talking about a decline and even we were expecting a decline to shake-out the loose hands, most amusing part was the justification for this decline.


You could see reasons from Fed to emerging markets unwinding, and from valuations to sentiment based complacency. Although all of these reasons are very valid reasons, one needs to thing about these in the context of the market.

Market Trend
According to Market Classification Matrix, a proprietary indicator that uses internal strength indicators that tell us about the strength of the market, we were in a uptrend. And therefore, instead of selling or panicking, we stayed long and kept our cool. No longs were exited.

Our proprietary trading model kept it's long positions. And as September 9th progressed, we realized that this sell-off was generating several buy signals. We will discuss some of the buy signals and the reasons why we think we are just starting the next rally phase, in the next posts. Even though the decline did not result in an immediate bottom for major indices, we saw a sharp rally on Monday after morning decline, which was followed by another two declines on Tuesday and Wednesday.

But the bottom line is that many people panicked while trend remained up. There were very few people who took advantage of the market when it was declining.


Tuesday, February 2, 2016

Downtrend Continues

Market resumed its decline in a major way today. More interesting than the decline was the muted reaction from the traders, as VIX did not spike. If fear doesn't spike with declines, it means that we have further decline ahead.

Market rallied last week but got way over-bought in just few days. In fact, a sell signal was generated on Friday. That sell signal resulted in decline yesterday from which the market initially recovered. However, it was too much weight for the market to carry. As a result, it gave way to serious selling today.

We have been maintaining that the stock market's inherent structure changed last year in August, and suggested a move to cash. Proprietary portfolio allocation model allowed us to diversify between bonds and short stocks. This portfolio has been performing very well so far this year (link). It is up +6.7% this year, while SP500 is down 6.7% this year. We will talk about latest results in the next post. Right mow, let's look at the structure of the market.

Nasdaq along with many other indices, is tracing out another head and shoulders pattern. This pattern is larger in magnitude than the prior pattern, and could result in substantial decline.


Over the next few days, market will fill the right shoulder of this pattern. Once right shoulder is filled and market breaks below the neck-line, significant decline can be in the offering.

Head and Shoulders are reversal patterns, and when you see a cluster of these patterns, as shown above, they become even more important. Overall, it means that the trend of the last 7 years has ended and we have entered a bear market. This would mean that the economy will slow down and we might see additional bad news coming from different market segments. Oil was the initial catalyst but now we could see other areas hurting.

However, many people are just realizing this new development and others are still oblivious to a market decline. But we prepared for this potential scenario and now are waiting for the downtrend to unfold over the next few months. Bonds remain in a bull market, as yields continue to decline.


Wednesday, January 13, 2016

Nasdaq Head and Shoulders Completed

Market is declining and Head and Shoulders have played out exactly in Nasdaq. We are in a #bear and we have been discussing this scenario since August 2015. 
 
Following chart was presented on January 4, 2016 (link).


Market so far has played out Head and Shoulders pattern to the target, as shown below.


Head and Shoulders patterns are forming in many other asset classes. We will review these in the next few blog posts.