Twitter

Showing posts with label Elliott Wave. Show all posts

Thursday, July 13, 2017

Stocks Approaching Dangerous Levels

Yesterday's rally in all of the major indices $DJIA, $SPX, $EEM, was very well received and triggered many tweets regarding Dow being at all time highs. Even President tweeted that stock markets are doing Great! I would recommend against such tweets because:
  1. What happens when the market goes down? If one owns a rising market, they would have to own the declining market as well, which could be much more negative.
  2. Market risks are increasing and we are close to a turn in the markets, which will correct post-election rally. Hence, a deeper correction can be expected. 
Following analysis supports the correction hypothesis (not a Bear market for now). Please note that below analysis is predictive and unlike mainstream finance, which is reactive, this analysis helps in understanding potential market move before time. This analysis also plays a pivotal role in our client portfolios (H1 2017 Performance has been shared). There are four key components:
  1. Structure
  2. Technical/Divergence
  3. Market Timing
  4. Sentiment
This correction could last for few weeks/months before resumption of the trend because we don't see a Bear market right away. But do you want to be part of a market when its going down and the headlines are negative? Some investment suggestions are included at the end.

Structure
Firstly, the Elliott Wave structure is nearing completion. Once this 5-wave rally completes, we will see a decline. Next decline could bring DJIA back to ~20,500. As for the upside, if current structure (As shown below) holds, Dow Jones Industrial Average cannot exceed 22,000, which is less than 500 points from yesterday's close.


One of the lesson that we have learned over past several years of market analysis is that one cannot and should not blindly believe on Elliott Wave structure without considering the market backdrop.

Divergences
Inter-market divergences highlight discrepancies between markets. These discrepancies typically take place in 5th wave where markets start diverging. We can currently seeing a divergence between SP500, DJIA and Nasdaq (shown below).


Please note that these divergences don't mean that long-term trend has reversed. On the contrary, there are no signals (structural or momentum) that this decline could lead to a new bear market.

Timing
Our proprietary market timing model has a key market turn date scheduled for July 14 (+/- 4 business days). Therefore, we can expect a top by next week.
This model has worked very well in the past and also serves as a key component of our proprietary strategies. We are working on developing a unique trading system around IPM, with potential go-live in 2018.

Sentiment
Following charts show that sentiment is very elevated. 

Long positions in DJIA are at all time highs, which does not bode well for a sustained rally.

Investor Intelligence survey respondents are mired in the bullish region for quite some time, and same is the case with Naaim survey results (charts courtesy of Babak).


Lastly, these two are very interesting.

TD Ameritrade users are very Bullish and are showing it with their trades. Since these are real retail investors, them being so bullish doesn't bode well for the markets.
More than half of E-trade users are also optimistic regarding the prospects of the market, which is another warning signal (Courtesy Noon Six Cap)

Positioning
Markets are at a critical juncture. Preparing for such a decline will depend on personal risk tolerance and tax considerations. Everyone should evaluate their investments through following key investing questions:
  1. Am I ready for a stock market trend change?  
  2. Will I have the mental strength to go against the herd?  
  3. Can I take advantage of new opportunities?
If you think you have too much exposure to stocks, you can reduce some exposure to be able to buy again. If your comfortable taking a hit to the portfolio knowing that you might not be able to enter back in time, it's better to ignore the news and remain invested. Worst thing a person can do is not reduce exposure at top and then get stressed with market/news, ad get out at the bottom, only to see a resumption of the rally.

Alternative Solution: We are helping clients answer above questions every day. And have developed our proprietary strategies to generate consistent returns, while taking advantage of new market opportunities and minimizing existing risk. We aim to provide Absolute Return Hedge Fund like strategies for individual investors through Managed Account model.

Feel free to contact us with any investment questions or if you would like to invest with us (Performance - H1 2017):

  • Twitter: @survive_thrive
  • E-mail: subscription.ust@gmail.com 
  • Comment below
  • You can also sign-up for free email updates below: 

Thursday, February 23, 2017

Market Behavior and Impact on Gold


Market Overview

Markets have rallied very significantly. First burst of the rally was after election till mid-December and the second burst has been from end of January till today. Impressively, our proprietary Market Classification Model remained long stocks during this entire period. Model turned bullish soon after Brexit and has remained bullish since July’16.

Although in the hindsight one can easily say that the market rallied and it was prudent to remain long throughout this time, most of the market participants did not stay long. In fact, there have been significant bursts of pessimism during this rally. For example:

  • Brexit induced anxiety
  • Election related stress
  • Post-election disbelief
  • Post Executive orders convolution

However, these kind of market panics are the very reason why this market has been able to rally this far – Market likes to climb a wall of worry.

Now that stocks have rallied sharply over the last two weeks, we are approaching a period of consolidation. Consolidation doesn’t mean a sharp decline rather a period of sideways action like we saw in January, to digest recent gains. A potential scenario is market topping towards the end of February, according to Inflection Point Model and then consolidating till next earnings reports to justify high prices.

Once this consolidation phase arrives, other assets like Gold are likely to outperform.

Gold

Gold has been consolidating for some time. And this consolidation is supported by a series of higher highs and higher lows, which means that the next stage rally could be very significant. Gold also remains in a Bull market and would be an ideal candidate for a continued rally.

Following chart shows Gold performance over the past 2 months, where a steady uptrend is clearly visible.

 
Gold stocks are also tracing out higher highs and higher lows. In fact, following chart shows a potential head and shoulders pattern being crafted out by the Gold stocks. Once this pattern is completed, Gold miners can easily make a run for the summer 2016 highs.


 Latest MCM report included details about Gold’s uptrend and where the trend is with respect to the overall bull market.

Upside potential is further amplified by the fact that Gold performs very well in an inflationary environment and with rising interest rates, we are likely entering an inflationary environment.

If your interested in free e-mail list or in Market Classification Model, please fill-out the form below.


Wednesday, November 30, 2016

Bond Market Buy Signals

After experiencing a sharp decline in the last ~2 months, bond markets is now consolidating. In fact, today it managed to rally above a critical level. If bonds can hold near this level for the next few days, intermediate trend would turn up.

This decline has resulted in multiple bond indicators turning bullish i.e. sentiment turning so pessimistic that it is now bullish. Three widely followed sentiment indicator readings are given below:

1- Hulbert Sentiment Index:
The blue line below represents bond yields. Bond yields move in the opposite direction to the bond prices. Red line indicates the sentiment towards bonds. At this point, it appears that the sentiment is as negative as we have seen in ~2 years. Therefore, there is a good wall of worry to support a bond rally.

2- Bund Sentiment
Bunds are German bonds. Bunds were among the bonds that went into negative yield territory. While they were negative, everyone was bullish on the future of Bunds. However, very few realized that it was more close to the end of the Bunds rise. On the contrary, right now investors are very bearish on Bunds. This suggests that this a good time to increase exposure to bonds
3- Bond Sentiment NDR indicator
According to NDR services, bond sentiment is now extremely pessimistic, which supports the argument that the Bond decline is over-extended and we should anticipate a rise in Bond prices:

Bond Market Trend
While we are seeing some very pessimistic sentiment readings, these are coming at a time when the Bond market remains in a bull market according to our proprietary Market Classification Model. Therefore, the prudent trade right now would be to add or maintain longs in the bond market.

Keep in mind that bond market has been rallying for over 30 years, and yields have been declining for the same period. This trend will eventually come to an end. The question is whether it has already ended or will end with one for decline.

In either case, bond yields will not go up right away. They will go up if the economy continues to improve and Federal Reserves raises interest rates couple of times. Fed's changes to short-term interest rates does not directly impact the longer-term interest rates because those rates are driven by market expectation.

In the next blog post, we will discuss the bond market structure and both Bull and Bear scenarios. Poor bond market is in no one's favor and the central banks will try their utmost to ensure interest rate rise remains in control. From an investment perspective, we might see 1 or 2 more opportunities to fund big capital purchases at a lower interest rate.

If interested in free e-mail list or in paid services, please fill-out the form below.

Monday, November 14, 2016

Bonds Market Analysis and Impact

After a dynamic and super-charged start of 2016, the long-term bond prices, as measured by TLT, are at the same level where they started the year - 120.6 vs 120.7 (shown below).

 
Above chart shows the amazing ascent and first six months and the sharp decline over past 4 months. Today's news is full of negative articles about the bond market rout, and potential consequences.

Bond market is the life blood of modern economies. There is hardly any developed country in the world that is debt free. Countries issue debt/bonds to implement development projects and repay any interest/payments that are due on existing obligations.

United States is a unique case where the government cannot just keep issuing bonds to raise money without any checks and balances. These checks and balances help keep the government debt in control, which supports the dollar and increases confidence among the lenders that they will get their money back.

This check/balance process is known as the debt-ceiling. Without confidence in the system, creditors might start hesitating in purchasing government treasuries, which could lead to higher bond yields, making it more difficult for US to finance future needs.

Orderly, rise and fall of treasury yield is very normal because it is governed by economic realities and Fed's actions. But sudden sharp rise, can be catastrophic for the overall economy. That being said, we are in a long-term downtrend in the bond yields, which will reverse one day in the near future.

Long-term view
In early 1980s, long-term treasuries were yielding 14%. They went as low as 2% in July 2016 - amazing time to refinance or make a big purchase at next to no interest rate.

However, this kind of decline will not last for ever. Typically, there is a ~30 year bond market cycle and right now we are near the bottom of the yield cycle. Following chart shows the yield decline structure.


Now the question is whether this trend has ended or does it have one last decline left in it? 

From a fundamental perspective, it is difficult to rationalize how the inflation can pick-up with oil, gold and other commodities being hit with higher dollar. If dollar rallies, it will pressure inflation and as a result, yields would come down.

Short-term View
From a short-term perspective, bond market has become extremely oversold. The sentiment is conducive to a sharp rally, as investors start to rationalize higher yields through new post-election economic realities. DSI sentiment is also extremely subdued.

Note - Election or no-election, economic realities don't change randomly. Rather, their interpretation changes but in the end everything cancels out in the direction of the primary trend

Following chart shows the near-term structure of the bond market. There are two ways to decipher this structure, but both ways suggest that this is a corrective structure. Below chart shows both the wave counts.


We will continue to monitor the bond market as we approach next month's Fed FOMC meeting. Fed might not raise the rates after an election surprise, which could give a boost to bond market.

Last Word
A collapse of the bond market will be a very bad scenario for investors and the economy. Abrupt rise in interest rates can destroy US abilities to pay existing obligations and could lead to a significant market impact. This impact might start from the US but could quickly spread through out the world. And once such a spiral starts, it is almost impossible to halt it in the middle.

If you are an investor with a substantial portfolio in bonds, you need to carefully watch for trend change in the bond market. Our proprietary Market Classification Model remains in a bull market for Bonds.

If interested in free e-mail list or in paid services, please fill-out the form below.


Wednesday, October 26, 2016

2016 YTD Strategy Performance

2016 has been a very difficult year for money managers and investors alike. They had to withstand many shocks through the first half of the year, which resulted in elevated volatility environment.

Once the volatility subsided and the markets started rallying after the Brexit,  investors got all excited about prospects of the market. However, this joy was short-lived, as markets have not made any progress since mid-July. Sideways action of last 3+ months has been strenuous for market participants and financial media. Financial media has been coming up with new reasons for the market to move but every time market declines to show its hand in either direction (up or down). 

While markets were going sideways and had a very difficult year, our proprietary investment strategy has handsomely out-performed the market - by 14.3%.

SP500 Performance (Jan 1 - Oct 25) = 6.7%
Conservative Strategy (Jan 1 - Oct 25) = 21%

Cumulative performance since January in relation with SP500 (total returns) is shown below:

This out-performance is happening at a time when hedge fund, mutual fund and all other critical performance indices are poorly under-performing the market. 

Risk Management
Furthermore, the beauty of this portfolio is not only in its performance, its in the way it manages risk and generates Alpha. The portfolio, as of today, has a component weighted Beta of 0.37. In other words, it is almost totally uncorrelated with the market. Therefore, markets rise/decline will not impact the returns of this portfolio. This means that almost all the gains can be treated as Alpha, while Sharpe ratio is 1.7

Agility
Model is also agile enough to take advantage of trend changes and re-allocate prior to big market moves.

In short, this portfolio can help diversify your risk, amplify returns, protect gains and provide peace of mind, so that investors can focus on more important things like think about next big idea, theme or change.

If interested in free e-mail list or in paid services, please fill-out the form below.


Tuesday, October 25, 2016

Inflection Point Model - Performance Recap

Inflection Point Model predicted a market turn date on Oct 21, 2016. Market declined on the 21st and then rallied. The rally continued today and futures are up now. With new catalyst along the way in the form of earnings from Apple and Google, we can expect more gains. Good thing is that even with today's very powerful rally, there was no sell signal. This suggests that the trend remains intact and is strong.

IPM Output - Turn date 10/21/16
Following chart shows the IPM model's output, as shared on Oct 17th (link)
Market Structure
Analyzing IPM model in conjunction with the market structure showed us that the trend had been sideways to down since mid July. Hence, the likely scenario was for market to put in a bottom during the IPM turn window and rally.

Following chart shows the latest structure shared on the blog along with a blue box, highlighting potential market turn window.


Following chart shows performance of SP500 as of today i.e. after bottoming within IPM turn window on Oct 21, one can observe the green bar with a gap up. Today's performance shows that the market gaped-up but did not cover the gap, hence, hinting towards a strong move. At the same time, confusing so many market participants, who have been taking failure of rallies as the new norm. 


Next Steps
We will continue to evaluate the market with respect to its structure and Inflection Point Model. One of the biggest benefits of the IPM model is to forecast potential market turn dates. And when IPM turn dates are combined with Market Classification Modal, it paints a much clearer picture. 

Market Classification Model is bullish. Next run of the model will be in next few days. Once the model is processed, it will tell us whether the internal strength of the market justifies a continued bullish posture or should one be wary of market trend changes. This information will be shared with subscribers immediately, so that they may evaluate their long investment positions.

Tomorrow's market Action
So far the futures are up and we could see a  continuation of the rally. This rally has a lot going for it but there are some signs of tiredness appearing in the market. We will evaluate the market structure and next IPM turn window in upcoming posts.

If interested in free e-mail list or in paid services, please fill-out the form below.

Saturday, October 22, 2016

Sideways Gyration Continues...

For more than 3 months markets have been going sideways. This sideways action is not only boring, its very straining for investors, economists and everyone else. As market goes sideways, investments don't yield returns which frustrate investors and they try to do things that more often than not hurt them. It's a way of market to throw us off our investment strategy. But the goal is to be not be dissuaded by the market and keep following a plan.

Along side regular investors, it significantly impacts options traders. Sideways market action is disastrous for option premium. As a result, options expire worthless. SP500 is currently at the same level as it was in early July. So over last 3 months, market has not gone any where.


If anything, it has a slightly downward trajectory since August. On one hand, this kind of market action is positive for long-term market gains, as market is digesting gains and will most likely breakout, it begs the questions whether we have seen the bottom or market still needs to do some work on the downside.

We are blessed to be up ~20% (YTD), while SP500 is up ~6%. Detailed performance analysis will be shared at the end of the month.

Identifying Next Market Move
Identifying a top or bottom remains a very difficult job. In order to correctly project market's next move, we need to take into account 4 items:
  1. Timing
  2. Structure
  3. Market Signal
  4. Confirmation
Without all of the above items lining-up, its premature to assume that trend has reversed.

Timing
In regards with market timing, we are currently within the Inflection Point Model's turn window. Window is shown above in blue box and is shown below:
Turn window will expire at the end of next week.

Structure
Market structure remains corrective but there is a potential that we can see a decline before sustainable rally. Therefore, if the market rallies and can sustain the rally, it will be signal of bottom. If the market cannot sustain the rally and starts declining in the next couple of days, it will suggest more work is needed on downside. 

Market Signal
If market performance over the next few days generates a technical signal, it will show us whether market will top or bottom within this turn window

Confirmation
Once the trend is set, we would need a confirmation by proprietary levels to confirm the move.

Conclusion
Market remains in a sideways pattern. This pattern will soon end but will confuse many market participants along the way. At UST, we know that the market is within a turn window, now we just need to wait for a market signal and confirmation to confirm the next move. 

Overall, market remains in an uptrend. And in the next post we will see the value of adhering to Market Classification Model. We will also be writing a series of posts on how our proprietary strategy fared in a confusing sideways market. This will be an amazing case study and I am thankful for the fact that we have seen this kind of market action because it will enable us to see the benefits of certain key aspects of our strategies.

If interested in free e-mail list or in paid services like Market Classification Model, IPM or others, please fill-out the form below.

Friday, October 14, 2016

Stock Market Bottom & Next Rally

Market's correction appears to be complete. It was a long drawn out process. After topping in early August, market went sideways with certain phases of sharp declines.

Market Correction
Recent market action has been one of the most choppy phases over last 6 years. Interesting, this choppy behavior did not result in a triangle. As you can see below, latest decline that ended yesterday, made a lower low below 2120 level. As a result, we can mark it a zig-zag correction.


Many market participants were expecting a break of  2120 to mark the start of selling. However, at this point it could turn out to be a bear trap, where market participants are caught off-guard with the rally. Furthermore, since recent correction was not a triangle, it can be regarded as a 2nd wave decline.

Approaching Rally
Investors who follow Elliott Wave theory know that after 2nd wave comes one of the strongest parts of the rally, knows as wave 3. Following chart shows that the market might be setting-up for a sharper rally in wave 3, which will easily take the market to all time highs and will take Nasdaq into the Vacuum zone, where it might get sucked up (details).


This rally phase will be continuation of the rally that started after Brexit vote!


Rally Support

Consolidation
Every rally needs fuel and if you look back at SP500 chart over last 2 years, latest decline brought SP500 back in the area where it was in Jan/Feb 2015 (shown below).


In other words, market has gone sideways for almost 2 years. This kind of consolidation suggests that there is a lot of energy available in the market if it wants to rally hard. Now that the earnings season is upon us, there will be enough catalysts to propel the market out of current range.

Buy Signal
Yesterday, market also generated a buy signal. This signal is another reason to be on the look out for a sharp rally.

Market Classification Model
Market Classification Model (MCM) is a long-term trend identification model. It went long at the end of June and since then it is bullish. Before that it went out of the market in Sept'15 and kept us away from the volatility during China/Oil scare of Jan/Feb'16 decline, then interest rate scare of Apr/May'16 and during Brexit volatility in June'16. All the while allowing us to be invested in assets that were yielding much higher returns.

However, since turning bullish at the end of June'16, it has remained bullish even during the recent decline when all of the financial media outlets started talking about a new bear market or severe correction. MCM allows us to stay on the right side of the market and add to long positions in case of corrections in bull-market. Otherwise, one might be scared to go long in a sideways market, not knowing whether it will turn into a bear market


If interested in free e-mail list or in paid services, please fill-out the form below.

Monday, October 10, 2016

Structural Analysis of Gold

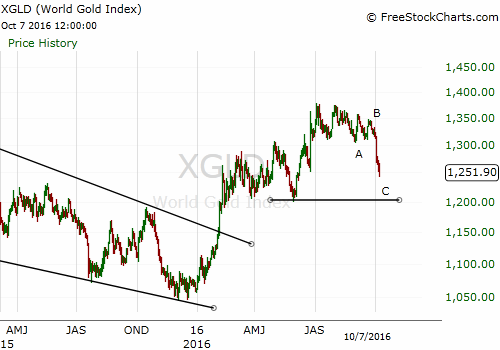
Gold has been declining for the past 2 months. Gold spiked after Brexit vote but since then it has gone sideways.


Above chart shows that the Gold bottomed at the end of 2015 and then rallied for more than 6 months. After topping in early July, Gold went sideways for 3 months before undergoing a sharp decline at the beginning of October'16.

However, interestingly, latest decline has just completed a 3-wave corrective structure in Gold. 3-wave corrections represent that the primary trend remains intact and we are just experiencing a minor pull-back in the asset.

A similar pattern is visible in Silver. But Silver is sporting a much more clearer structure. Recent correction was clear 3-waves with a triangle in the middle. 


Furthermore, Silver is sporting a series of 1s and 2s which means that a big rally is coming in the Silver market. And when Silver starts to rally hard, it is a good time for Gold to follow.

Now that the Gold and Silver are showing that they are undergoing correction in broader uptrend, let's look at the Gold stocks. Gold stocks have rallied amazingly since the beginning of this year. Almost 200% rally from January bottom in GDX. Recently, they have also undergone similar correction over the past few months.

Following chart shows the performance of gold stocks:


Gold stocks clearly show a 3-wave decline, which means that this is just a correction and primary trend will resume soon.

Overall, the trend remains up in precious metals as shown by the market structure analysis. Market Classification Model also remains in a bull market for Gold. Therefore, we are very close to a bottom of this correction in Gold and will soon see a resurgence in the yellow metal.

If interested in free e-mail list or in paid services, please fill-out the form below.


Sunday, August 21, 2016

Stock Market Structure

Stock Market and Bond market action suggests that both markets are consolidating. Once this consolidation is complete in the stock market, we should see a rally. 

We discussed about the potential of sideways market action and formation of a head and shoulders pattern on Aug 8th. As of Aug 21, market has traced out the right shoulder. 


Aug 8, 2016


Aug 21, 2016
Now that the right shoulder is almost complete, next step is to analyze the market structure to identify next steps. 

From an Elliott Wave perspective, market is currently in the last wave of the up-move. When we say last wave, it by no means mean that this will end the bull market. Instead, it just means that the current rally phase will give way to relatively large decline.


Recent market consolidation has helped in reducing market participants' optimism over the past few weeks, as evident from recent surveys. This will help in the next short-term rally phase. However, since the market is nearing the end of the larger rally phase which started with Brexit vote, we will see a resurgence of optimism and sharper decline.

In the above chart, a box is placed to show potential price and time range of market top based on Fibonacci relationship and IPM market timing analysis.

Overall market trend remains up. Even if the market declines, it will lead to higher prices till the time Market Classification Model is in Bull territory for the stock market.


MARKET CLASSIFICATION MODEL
A proprietary algorithm that classifies market conditions i.e. Bull market or Bear market. Currently, this model is suggesting a longer-term up-trend for the US Stock Market. In fact, this model is close to triggering another new Bull trigger.

Friday, August 19, 2016

Bond Market Update and Impact on Stocks -

A very quite week from all perspectives. Even with the Federal Reserves meeting minutes, the overall temp of the week remained slow. All of the major asset classes went sideways. SP500 was up +0.2%, while Bonds were down -0.5%. This kind of market action suggests that last week was very non-eventful and something big is coming-up in the near future.

We have already talked about the next stock market turn window - scheduled for around August 30th. Analysis suggests that the next turn would most likely be a near term top.


Therefore, with a turn window approaching and Jackson Hole summit scheduled for next week, there is a very good potential of market rallying next week.


Bond Market Bear Scenario


Typically if stocks rally, bonds decline. At the same time, bonds have other reasons for a decline. From a technical perspective, bond market is tracing out a bearish pattern. Following chart shows bonds consolidating in a triangular form, after July's sharp decline. Typically, this kind of consolidation is followed by a break in the prior direction.


Another reason to consider this scenario is that blue average can act as magnet on this decline. This decline will have deeper consequences for the entire market for the month of September. We will discuss these consequences in the next post.


Bond Market Bull Scenario


Just to provide a perspective on market action, good investors should also consider all the scenarios. From a bull perspective, market seems to be undergoing a sideways correction in a triangle form. This consolidation will result in an immediate break to the upside.


The problem with this scenario is that, this would mean stocks would go down. However, it seems unlikely because the Jackson Hole meeting and IPM turn window suggest a stock market rally.


Conclusion


A bond market decline and stock market rally makes the most sense. But please keep in mind that Bonds and stocks both are in bull markets, according to our proprietary Market Classification Model. MCM has kept us on the right side of the trade and has resulted in some amazing YTD results in 2016.


Subscription to MCM is open for investors (Services). 

Wednesday, April 27, 2016

Benefits of Model - Part 3

With Federal Reserves not raising the interest rates and Bank of Japan maintaining negative interest rates, the markets are primed for some interesting action. At this point, one must ask:
  • Why is the Fed so uncertain? 
  • What are they seeing that even with stock market (SP500 and DJIA) near all time highs, they are not willing to increase the rates?


We know that the economy is not very strong. And it is a good decision from the Fed to not raise rates. However, what type of signal will it send to the investors? Is it time to be wary of the stocks as the economy struggles or is it time to get aggressive?

The question then becomes, even though the Fed has maintained the interest rates for now, how long can they maintain this posture? Will they not increase the rates on the first sign of strengthening economy? In that case, if the May jobs report comes in very strong, which is expected based on last week's extra-ordinarily strong weekly claims data, will that push Fed over the edge to raising rates at June's meeting?

In short, there are so many questions on the fundamental side. Similarly, from a technical perspective there are also several questions. At this time, the best strategy for any individual could be to stay out of the market and wait for the market to show its true direction, which could result in a delayed entry into a good long/short position. Or follow a system that takes out emotion from the investments. Since we have been using the Portfolio Enhancement Algorithm since the start of 2016, we decided to analyze the Q1' 2016 performance.

In the last few blog posts, we have discussed the benefits of Portfolio Enhancement Algorithm based in 2016 based on real-time performance with real money (as of April 12th, model was up ~9%, while SP500 total return index was up ~2.5%. 
Following are some additional benefits that we realized by using the model during Q1' 2016.
5. Trend/Momentum following ability

Model offers the ability to utilize two of the most basic concepts of investments that help investors in the long run. In fact, hedge funds, which made a lot of money in 2015, were momentum following hedge funds. These funds realized that oil price decline had strong momentum and therefore, continued to hold short positions in oil.

As long as one can stay with the trend, investments pay off in the long run. My 8 years of experience in the financial industry has confirmed the adage that "Trend is your Friend." If a person tries to fight the trend, it’s possible that he might make few good trades but in the long-run the investment account will suffer. 

Although there are indicators and analysis techniques that allow a person to identify potential areas of trend changes and market timing, there is no Holy Grail. Therefore, the best option for investors is to stay with the trend. While staying with the trend, it’s imperative to have risk management facets to guide one about potential upcoming changes in the market structure.

This is similar to regular health checks that one undergoes to see how a person is doing internally. If one doesn't do health checks, they won't get a forecast of what is going on inside his/her body. As a result, it can be too late when one reacts to the new developments. In order to mitigate such risks in the investment world, this model has in-built risk management and market health check mechanisms.

6. Positioning for Next Market Move 

Another key aspect related to risk management and market health check is the ability of the model to position for the upcoming move in the appropriate area. It’s always critical to position one's portfolio before a move happens rather than reacting after a move has started. This not only reduces the stress, but allows one to establish a good position

Since majority of portfolio gains occur at the start of a new rally phase, if a person waits for the rally to begin, they might miss on the lion share of the move. On the other hand, if a person enters too early they might sell before the move actually starts. As a result, it’s always critical to correctly position the portfolio for next moves and have confidence in the allocation.

This is another huge benefit of this model that it allows us to position the portfolio for an upcoming move without taking too much risk and ensuring enough diversification with risk management perimeters. As a result of these benefits, this model can be applied in any portfolio and can be used with leverage to compound returns.

As an example, the model allowed us to position in such a way that we benefited from the Jan/Feb 2016 market decline and then allowed us to mitigate losses through accurate positioning in March, followed by sharp gains during the last week of March and first week of April.

  • Buy and Hold features
  • Quantitative benefits:
    • Beta
    • Sharpe Ratio
    • Alpha

Monday, February 8, 2016

Employment Numbers, Economy and Market

Economy continues to perform below expectations. Latest job numbers were OK but not GREAT. I don't think they are even good enough to justify future rate hikes. But unfortunately Federal Reserves is locked into this situation where they have already committed several rate hikes for 2016. Although they won't do four hikes in 2016, any hikes will result in a flattening yield curve and possibly lead to negative yield curve.

Yield curve inversion typically leads to a recession. Although the numbers are not showing eminent recession right now, the stock market is now surely discounting a significant slowdown in economic activity. If the economy is to enter a recession, we could see further losses in the market.

From a socioeconomic perspective, a recession/bear market in the final year of election, could pave the path for a socialist president in the form of Bernie Sanders because people will be angry towards capitalists.

Getting back to economy, industrial activity has slowed considerably, which is an indication that the manufacturing sector is already in a recession. Number of job cuts being announced reminds us of the days of the great recession, when the news was always about reduction in workforce. When you have job-cuts coupled with tightening Fed policy, restricting the money flow, it just exacerbates the economic situations.

In fact, it leads the economy into a death spiral where one negative news feeds the other negative thing and so the cycle continues. For example, reduction in jobs will result in lower spending, which will in turn reduce profits, resulting in lower stock prices and cost-cutting measures, which will result in more job-cuts.

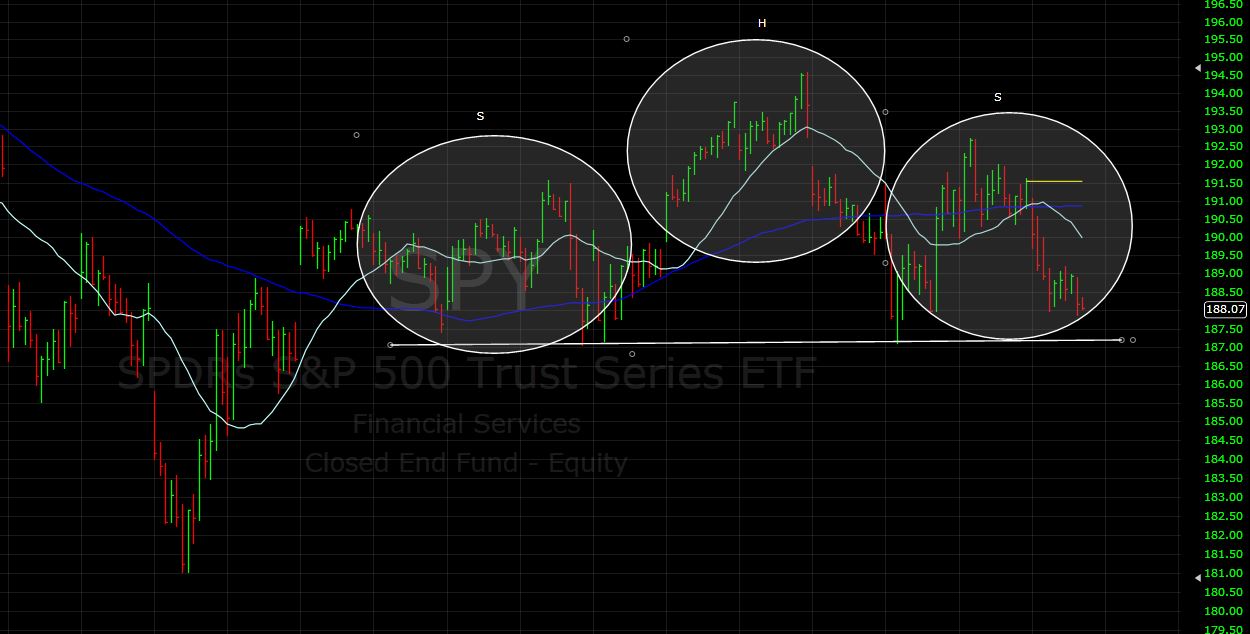
Under these circumstances, stock market is tracing out a series of mini-head and shoulders patterns. As you know head and shoulders pattern are topping formation. These patterns also appear in a downtrend as continuation patterns. Following chart shows H&S pattern in SP500.


If market declines in the next few days, this pattern will be broken and January lows will be tested. This will allow the market to complete the right shoulder of a longer-term head and shoulders pattern (discussed here)

Under these circumstances, the best option is to stay out of the market and wait for a trend change before going long again. Bonds remain in a bull market, so they can be a good place to park cash and ride-out this rough patch in the stocks, which could last for the next few quarters (at least).