Twitter

Showing posts with label Market timing. Show all posts

Thursday, March 16, 2017

Next IPM Model Turn Window

After briefly topping at the last turn date of Feb 28, 2017 (link), market rallied yesterday on Federal Reserve's announcement. 

Market Condition

  • During the correction since Feb 28, market did not generate any sell signals. In fact, it generated several buy readings from oversold perspective. 
  • At the same time, Sentiment as subsided in the past few weeks, which will provide fuel for this rally to continue. 
  • From a government perspective, they are busy with controversies and will not be able to influence the market. 
  • Furthermore, Dutch election results were positive for the overall geo-political situation

Hence there are no significant headwinds in front of the stocks right now.

We remain long the stock market because Market Classification Model remains bullish, which turned bullish on stocks in July 2016 and has remained bullish ever since (2017 Investment Performance). However, it is critical to understand potential future turn dates.

According to latest Inflection Point Model re-run, stocks will likely experience turbulence in the first week of April. Following chart shows the IPM model output.
IPM Model turn date is scheduled for April 5 (+/- 4 days). Most likely, this will turn out to be another intermediate top, which will last till majority of companies start reporting their earnings in mid April. However, it will be sufficient enough to make bears out of many longs. 

We will continue to evaluate the market conditions for any sell signals, as we approach this turn date. In the mean time, it seems like this rally could continue for another ~2 weeks.

If your interested in free e-mail list or in paid services like Market Classification Model, please fill-out the form below.

Tuesday, February 7, 2017

2017 Investment Themes

There are many prominent investment themes for 2017. Investment themes help investors understand the broader investment landscape based on historical performance of different asset classes and their current catalysts. This analysis helps in properly positioning one's portfolio to take advantage of the winds of change.

US Stock Market

SP500 and DJIA have experienced an amazing 1 year rally. Since Feb 2016, markets are up ~30%. With such a sharp rally, it won't be wrong to expect a sideways/downward market correction. Since corrections can come in different forms, sideways correction with time will help in digesting last year's gains just like a sharp fall in prices.


Lofty price levels can be supported by equally good earning numbers, which can provide further fuel for the rally. However, with the uncertain political dynamics in the U.S. we should be prepared for any sudden decline in the US stock prices like 1987 market crash - not a certainty but a word of caution.

Note: Next earnings will be reported in mid-April 2017


Emerging Markets

On the other hand, emerging markets finished a 5 year long correction in 2016. As US markets rallied, emerging markets corrected from 2011 to 2015. Since bottoming in 2016, emerging markets have rallied and looks like they have formed an inverted head and shoulders pattern. Once they breakout, emerging markets could go up to there 2011 highs. Therefore, this is an area to keep in mind.


Precious Metals

Gold had been declining since 2013. It bottomed in early 2016 and then rallied sharply. However, since mid-2016, Gold has again experienced a major pullback. However, we think that this pullback is a buying opportunity and would result in higher prices. 

Following chart shows a potential inverted head and shoulders pattern being formed by gold. Once this pattern is complete, gold can make an advance towards all-time highs around 1900. However, the first target would be to reach July 2016 highs. Therefore, gold is an area which one should keep on his/her radar for investment opportunities.


Precious metals are also influenced by the US dollar. US dollar has rallied very significantly over the last two years or so. Therefore, as the US Dollar corrects, it will provide fuel for a rally in the precious metals complex.

Bonds

Bond have been in a long-term bull market. In fact, its one of the biggest bull markets in history of bond prices. However, the bond price cycles are turning and so are the prices. Now the question is whether the Bond Bull has ended or it still has some life left.

Bond prices started declining in mid 2016 and have reached a critical area. Prices should reverse to the upside soon or they will mark the end of the Bond bull, which can be disastrous for the debt-laden global economy. We will keep a tab on the Bond market to understand clues for the future of the US economy.


Investment Options

We are working very hard to make these strategies available for investors. If you are interested in investing, you can register below and we will send you update when the strategy is available for investments. Some of the key outputs from the data models used in this strategy are also available through subscription

Saturday, October 22, 2016

Sideways Gyration Continues...

For more than 3 months markets have been going sideways. This sideways action is not only boring, its very straining for investors, economists and everyone else. As market goes sideways, investments don't yield returns which frustrate investors and they try to do things that more often than not hurt them. It's a way of market to throw us off our investment strategy. But the goal is to be not be dissuaded by the market and keep following a plan.

Along side regular investors, it significantly impacts options traders. Sideways market action is disastrous for option premium. As a result, options expire worthless. SP500 is currently at the same level as it was in early July. So over last 3 months, market has not gone any where.


If anything, it has a slightly downward trajectory since August. On one hand, this kind of market action is positive for long-term market gains, as market is digesting gains and will most likely breakout, it begs the questions whether we have seen the bottom or market still needs to do some work on the downside.

We are blessed to be up ~20% (YTD), while SP500 is up ~6%. Detailed performance analysis will be shared at the end of the month.

Identifying Next Market Move
Identifying a top or bottom remains a very difficult job. In order to correctly project market's next move, we need to take into account 4 items:
  1. Timing
  2. Structure
  3. Market Signal
  4. Confirmation
Without all of the above items lining-up, its premature to assume that trend has reversed.

Timing
In regards with market timing, we are currently within the Inflection Point Model's turn window. Window is shown above in blue box and is shown below:
Turn window will expire at the end of next week.

Structure
Market structure remains corrective but there is a potential that we can see a decline before sustainable rally. Therefore, if the market rallies and can sustain the rally, it will be signal of bottom. If the market cannot sustain the rally and starts declining in the next couple of days, it will suggest more work is needed on downside. 

Market Signal
If market performance over the next few days generates a technical signal, it will show us whether market will top or bottom within this turn window

Confirmation
Once the trend is set, we would need a confirmation by proprietary levels to confirm the move.

Conclusion
Market remains in a sideways pattern. This pattern will soon end but will confuse many market participants along the way. At UST, we know that the market is within a turn window, now we just need to wait for a market signal and confirmation to confirm the next move. 

Overall, market remains in an uptrend. And in the next post we will see the value of adhering to Market Classification Model. We will also be writing a series of posts on how our proprietary strategy fared in a confusing sideways market. This will be an amazing case study and I am thankful for the fact that we have seen this kind of market action because it will enable us to see the benefits of certain key aspects of our strategies.

If interested in free e-mail list or in paid services like Market Classification Model, IPM or others, please fill-out the form below.

Friday, October 21, 2016

Stock Market Consolidation & Break-out Levels

Since July, market has been going sideways to down. This downdraft has been persistent, boring and choppy. While markets are still within 1-2% of all-time highs, this choppy action has brought forward a lot of bears and helped improve the valuation measures like P/E ratios. 

In fact, the true purpose of these kind of market declines/sideways corrections is to reduce optimism and lay the foundation for the next rally phase because investors get tired of the market performance.

Sentiment - Fear/Greed Indicator
CNN's fear greed indicator is suggesting that the frothy sentiment that we saw in mid July has now been replaced by lack of enthusiasm towards the market. 


In fact, the sentiment is as negative right now, as it was at the time of Brexit. Therefore, we can see another sharper rally from these levels.


Signs of a Break-out
While market's decline has been choppy in nature, it is along the top downtrend trend line. One key indication of a market trend reversal would be a break of the trend line to the upside. For DJIA, this trend line is currently at 18,300.  


A similar situation is present in case of SP500, where the downtrend line is crossing at 2166.


Therefore, a sustained rally of 100 points in DJIA and ~20 points in SP500 would confirm a break-out.

Overall, the markets remain in an uptrend. Market Classification Model remains in an uptrend. Therefore, there is a very high probability that we will soon experience a market break-out. Long lasting sideways action is preparing for a break-out after resetting optimistic sentiment, market valuations and technical indicators

If interested in free e-mail list or in paid services like Market Classification Model, IPM or others, please fill-out the form below.

Wednesday, October 5, 2016

September Performance Recap

September was a volatile month in the markets.

If you look at the SP500 chart, it has been going sideways and frustrating many market participants.


As we mentioned in the last post, pretty much all the major asset classes have experienced sideways action over past month.

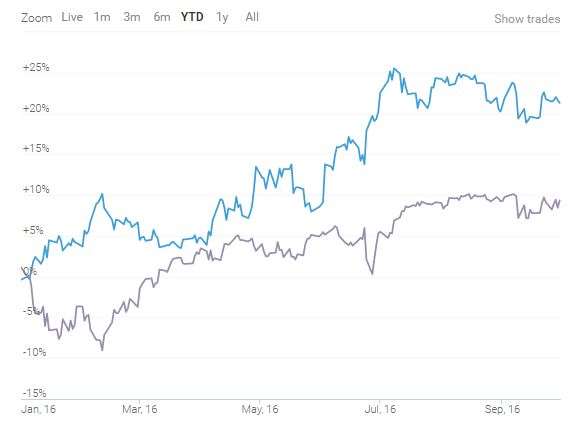
2016 has been a volatile year so far with markets declining sharply in Jan and February, followed by a nice rally. During these volatile times, our proprietary strategy has out-performed the SP500 by 16.3%.

SP500 Performance (Jan - Sept) = 7.8%
Conservative Strategy (Jan - Sept) = 24.1%

Cumulative performance since January in relation with SP500 (total returns) is shown below:


Monthly Performance: 

Following chart shows monthly variation in performance.


Model is agile enough to take advantage of trend changes and re-allocate in strategic positions prior to big market moves.

All of these returns are for a portfolio whose current Beta is 0.32 and whose YTD Beta is -0.57, which means that these returns are totally uncorrelated with the market. Therefore, portfolio has a very high Alpha.

If interested in free e-mail list or in paid services, please fill-out the form below.


Sunday, October 2, 2016

September 2016 - Market Recap

September was a volatile month for all asset classes, as it started with a sharp decline in Stocks, Bonds and Gold. We will discuss these assets below and will leverage this information for October forecasts.

However, need to highlight that last IPM turn window was scheduled for September 26th. Market has made a bottom on September 26th and it's possible that we will see a sharp rally in the next few weeks. We will share details on the IPM turn window in next couple of posts. We are already positioned in our aggressive IPM based strategy to take advantage of this date.

Bonds

  • Since the start of September, Bonds experienced severe decline
  • Decline brought out the bears, as expectations of an impending FED rate hike increased
  • The decline was so severe that at one point, TLT has decline -4.4% by mid month
  • This decline was followed by a sharp rally to near break-even levels for the month
  • In summary: A lot of volatility but no real action / direction, which is apparent from following chart

Stocks

  • Stocks opened September slow but soon after the long weekend and on the heels of a strong jobs report took a nose dive

Gold

  • In contrast to Stocks and Bonds, Gold started with a sharp rally. However that rally fizzled out
  • Since then, Gold has been going sideways. There are two options for the Gold in the month of October:
    1. Gold and precious metal complex has already bottomed and will soon rally to new highs
    2. Gold has traced out a triangle and will decline in October, to mark a bottom
  • Both of the above scenarios suggest that the metal will be higher in future months. The question is whether it will take a detour to lower prices before rallying


Summary

  • Consolidation is the name of the game
  • Overall SP500 gained +0.02 %, Bond lost -1.7% and Gold gained 0.7%
  • We will soon see a well-defined trend but volatility might continue till Presidential elections in November.

Upcoming Blog posts:

  1. Strategy Performance - September recap
  2. Forecasts for October
    • Stocks - Elliott Wave and IPM Model
    • Bonds - Structure and relationship with stocks
    • Gold - Long-term targets and patterns
  3. Performance of Options strategy based on IPM Model

If interested in free e-mail list or in paid services, please fill-out the form below.


Tuesday, September 20, 2016

Pre-Federal Reserves and BoJ Analysis

Sideways Action Continues

This week, so far, has been as uneventful as prior week. Yesterday, markets opened higher but then sold-off towards the end to close slightly negative. Today, markets closed slightly positive. Since last Monday, market has gone net sideways without any major directional move.

Following chart shows that today we closed at the level where we close on Sept 9th, when the world was coming to an end and DJIA had just declined ~4%


Markets are like a coiled spring. And it seems like the entire world is waiting for the Central Banks. Bank of Japan is going to announce its policy statement early in the morning, while Fed announcement will come at 2 PM.


Bank of Japan and Yen

From Bank of Japan perspective, they would like Yen to decline because that was the catalyst to push Nikkei higher couple of years ago. Right now, Commitment Of Trader data (shown below) shows that the market is ripe for another decline in Yen, which means that its likely Japan will reduce interest rates further or introduce some sort of monetary stimulus.


If BoJ stimulates the market and forces a decline in Yen, we can expect a rally in the indices.


Technology getting ready for a Break-Out

While the US markets have been going sideways, Nasdaq has traced out an inverted head and shoulders near all time highs (shown below):

These highs are 16 years old and there is vacuum above this level. If this pattern holds, we can expect a sharp rally in the near future. This rally can start in parallel with central banks announcements or it can start after a decline following Federal Reserves announcement. In any case, this is a very positive development for the market.

If Nasdaq can lead the market, we can be sure that the overall market will follow and that the recession talk will substantially subside. According to Market Classification Model, we remain in an uptrend. Uptrend typically results in rallies and market participants find reasons to be bullish even in front of negative news.


Strategy Performance

Our proprietary model has been performing very well so far this year. Even with recent 2.5 month sideways consolidation, model is up 22.1% vs 6.3% rise in SP500. We will continue to monitor the performance of this model and share updates. This model will be available for investors to replicate or invest in towards the end of the year.


If interested in free e-mail list or in paid services, please fill-out the form below.


Wednesday, April 27, 2016

Benefits of Model - Part 3

With Federal Reserves not raising the interest rates and Bank of Japan maintaining negative interest rates, the markets are primed for some interesting action. At this point, one must ask:
  • Why is the Fed so uncertain? 
  • What are they seeing that even with stock market (SP500 and DJIA) near all time highs, they are not willing to increase the rates?


We know that the economy is not very strong. And it is a good decision from the Fed to not raise rates. However, what type of signal will it send to the investors? Is it time to be wary of the stocks as the economy struggles or is it time to get aggressive?

The question then becomes, even though the Fed has maintained the interest rates for now, how long can they maintain this posture? Will they not increase the rates on the first sign of strengthening economy? In that case, if the May jobs report comes in very strong, which is expected based on last week's extra-ordinarily strong weekly claims data, will that push Fed over the edge to raising rates at June's meeting?

In short, there are so many questions on the fundamental side. Similarly, from a technical perspective there are also several questions. At this time, the best strategy for any individual could be to stay out of the market and wait for the market to show its true direction, which could result in a delayed entry into a good long/short position. Or follow a system that takes out emotion from the investments. Since we have been using the Portfolio Enhancement Algorithm since the start of 2016, we decided to analyze the Q1' 2016 performance.

In the last few blog posts, we have discussed the benefits of Portfolio Enhancement Algorithm based in 2016 based on real-time performance with real money (as of April 12th, model was up ~9%, while SP500 total return index was up ~2.5%. 
Following are some additional benefits that we realized by using the model during Q1' 2016.
5. Trend/Momentum following ability

Model offers the ability to utilize two of the most basic concepts of investments that help investors in the long run. In fact, hedge funds, which made a lot of money in 2015, were momentum following hedge funds. These funds realized that oil price decline had strong momentum and therefore, continued to hold short positions in oil.

As long as one can stay with the trend, investments pay off in the long run. My 8 years of experience in the financial industry has confirmed the adage that "Trend is your Friend." If a person tries to fight the trend, it’s possible that he might make few good trades but in the long-run the investment account will suffer. 

Although there are indicators and analysis techniques that allow a person to identify potential areas of trend changes and market timing, there is no Holy Grail. Therefore, the best option for investors is to stay with the trend. While staying with the trend, it’s imperative to have risk management facets to guide one about potential upcoming changes in the market structure.

This is similar to regular health checks that one undergoes to see how a person is doing internally. If one doesn't do health checks, they won't get a forecast of what is going on inside his/her body. As a result, it can be too late when one reacts to the new developments. In order to mitigate such risks in the investment world, this model has in-built risk management and market health check mechanisms.

6. Positioning for Next Market Move 

Another key aspect related to risk management and market health check is the ability of the model to position for the upcoming move in the appropriate area. It’s always critical to position one's portfolio before a move happens rather than reacting after a move has started. This not only reduces the stress, but allows one to establish a good position

Since majority of portfolio gains occur at the start of a new rally phase, if a person waits for the rally to begin, they might miss on the lion share of the move. On the other hand, if a person enters too early they might sell before the move actually starts. As a result, it’s always critical to correctly position the portfolio for next moves and have confidence in the allocation.

This is another huge benefit of this model that it allows us to position the portfolio for an upcoming move without taking too much risk and ensuring enough diversification with risk management perimeters. As a result of these benefits, this model can be applied in any portfolio and can be used with leverage to compound returns.

As an example, the model allowed us to position in such a way that we benefited from the Jan/Feb 2016 market decline and then allowed us to mitigate losses through accurate positioning in March, followed by sharp gains during the last week of March and first week of April.

  • Buy and Hold features
  • Quantitative benefits:
    • Beta
    • Sharpe Ratio
    • Alpha

Tuesday, February 2, 2016

Downtrend Continues

Market resumed its decline in a major way today. More interesting than the decline was the muted reaction from the traders, as VIX did not spike. If fear doesn't spike with declines, it means that we have further decline ahead.

Market rallied last week but got way over-bought in just few days. In fact, a sell signal was generated on Friday. That sell signal resulted in decline yesterday from which the market initially recovered. However, it was too much weight for the market to carry. As a result, it gave way to serious selling today.

We have been maintaining that the stock market's inherent structure changed last year in August, and suggested a move to cash. Proprietary portfolio allocation model allowed us to diversify between bonds and short stocks. This portfolio has been performing very well so far this year (link). It is up +6.7% this year, while SP500 is down 6.7% this year. We will talk about latest results in the next post. Right mow, let's look at the structure of the market.

Nasdaq along with many other indices, is tracing out another head and shoulders pattern. This pattern is larger in magnitude than the prior pattern, and could result in substantial decline.


Over the next few days, market will fill the right shoulder of this pattern. Once right shoulder is filled and market breaks below the neck-line, significant decline can be in the offering.

Head and Shoulders are reversal patterns, and when you see a cluster of these patterns, as shown above, they become even more important. Overall, it means that the trend of the last 7 years has ended and we have entered a bear market. This would mean that the economy will slow down and we might see additional bad news coming from different market segments. Oil was the initial catalyst but now we could see other areas hurting.

However, many people are just realizing this new development and others are still oblivious to a market decline. But we prepared for this potential scenario and now are waiting for the downtrend to unfold over the next few months. Bonds remain in a bull market, as yields continue to decline.


Wednesday, January 13, 2016

Nasdaq Head and Shoulders Completed

Market is declining and Head and Shoulders have played out exactly in Nasdaq. We are in a #bear and we have been discussing this scenario since August 2015. 
 
Following chart was presented on January 4, 2016 (link).


Market so far has played out Head and Shoulders pattern to the target, as shown below.


Head and Shoulders patterns are forming in many other asset classes. We will review these in the next few blog posts.

Monday, January 4, 2016

New Year and the Stock Market

Happy New Year. Although today is the first trading day of the year, markets opened at negative 300. From a such a negative opening its very hard to make a come back and close in the positive territory. And market declines on the first day of the year, odds of a losing year are at 50% based on historical data (link).  

At Understand, Survive and Thrive, we suggested that the market has undergone a trend change back in September (link).  However, we suggested that shorting opportunity is not here, and we should wait for a market rally. Experience shows that markets rally after a sharp decline for two reasons:

  1. To entice weak hands into the market as buying opportunity
  2. To shake shorts who were early to the game
Once the mood changes, markets start their decline phase, which is persistent. At this point, the possibility of a prolonged decline has increased sharply. In fact, several of the high fliers like MSFT, NetFlix and others are down big today, which shows that the leadership is now leaving the market.

This is also evident from the structural integrity of the market. Stock market patterns can provide very valuable insights into the performance of a particular stock or the over all market. We discussed in December (link) that the market is tracing out a Head and Shoulders pattern, which symbolizes potential trend changes. That pattern is still in plan. But now another Head and Shoulders pattern is visible in Nasdaq (shown below).


Once this pattern is completed, which is almost complete, we can see a sharp sell-off to the downside. This could take the prices down to prior base level i.e. potential 6%+ decline from current levels.

One might ask what can cause such a decline. Although there are many reasons that we will read in the news for today's decline, earnings will be the primary driver, which start in 2 weeks. As economy weakens, earnings will dwindle and stock market will follow. So in the situation what an investor must do?

Following are some of the strategies that we are applying to navigate through this situations:
  1. Invest in assets that are in bull markets (Bonds)
  2. Exit longs from stocks
  3. Short indexed ETFs with predefined mix of diversified assets and risk mitigation startegies
  4. Keep powder dry for upcoming bull markets in other asset classes
 

Wednesday, February 19, 2014

IPM Trade Matrix Update - Trade 5 (Part 5)

Trade Overview
Today's market action was very constructive. While on one hand large caps like DJIA and SP500 absorbed recent gains by going sideways, small caps and tech stocks rallied sharply. This rally in small caps is a very encouraging sign for the broader market rally. Furthermore, breadth during this rally has been very impressive. 

Following chart shows a smoothed Advance/Decline line. According to this chart, market breadth hasn't been this strong in a while. 

Please note that this chart has two implications:
  1. We won't enter a new bear market right away i.e. current rally has a ways to go: 1929 comparison should not be taken seriously
  2. We might be approaching an overbought area and could see a pull-back over the next couple of weeks.
This chart also confirms IPM Trade Matrix's buy signal. The only difference is that the IPM Trade Matrix generated its signal several days before the breadth jump. Therefore, IPM Trade Matrix is a real-time actionable system with greater profit possibilities. 

Our Elliott Wave structural analysis of the market suggests that the market is in a firm uptrend. We are at least a week away from an intermediate term correction. Please note that this will not be a serious correction. It might just fill-out the right shoulder of the Inverted Head and Shoulder pattern (discussed earlier). IPM Top date has already been e-mailed to subscribers.


As evident from the above chart, market has just completed a sequence of 1s and 2s. As long as the stop levels are not broken (outlined below) we will stay long. If profit objectives for TNA are hit, we will bring our trailing stops closer per IPM Trade Matrix definitions and will let the market decide its next move.

Elliott Wave analysis cannot be completed without sentiment analysis. And current sentiment analysis suggests that we are still not seeing optimism in the market. This is  very good for the health of this rally. We will keep an eye on the stop levels and profit objectives, as we are approaching the end of Trade 5 per IPM Trade Matrix.


IPM Trade Matrix 2014 Trades

TRADE - 1: (Long) = +2.6%
TRADE - 2: (Short) = +9.3%
TRADE - 3: (Long) - Non IPM Trade Matrix trade -0.2%
TRADE - 4: (Short - 1/31/14 to 2/5/14) +7.25% 

TRADE - 5: Long
Long TNA at 70 ==> new TNA basis = 69.94 (added few longs today) 
Longs were initiated on 2/11/14 and 2/13/14 based on IPM Trade Matrix Trigger and Elliott Wave structure. More might be added if opportunity comes within IPM turn window. 

TRADE CONDITIONS
Condition: Bottom within IPM Turn Window  
Trigger: Rally above SP500 = 1789, DJIA = 15790, Russell 2000 = 111.5, Global Dow = 2401
Supporting Indicators: Up trend (8/4 did not complete), Next IPM can be either Top/Bottom

PROFIT TARGETS
Profit Target 1: 1870
Profit Target 2: 1930

RISK
Stop: Break below 1750 (valid till we are within IPM Turn Window)
Trailing Stops: Break below 1790 (SP500) and 15780 (DJIA)
Typical IPM Trade Matrix Risk: 1.5%
Actual IPM Trade Matrix Risk: 1.3% (Entry = 1813, Exit = 1790, Risk = 1.3% )
Risk Reason: There are multiple reasons to be worried: 1929 stock market parallel, 8/4 Test to the downside is in process (will be invalid at new highs) - almost invalid, and major IPM Bottom window in process - almost invalid.  

Applicable Rule (There are 7 Rules in the IPM Trade Matrix. Following are applicable to the market right now): 
  1. Do not go long or short without trigger to prevent losses by market moving against you.  
  2. Exit half at profit objective 1. Exit full at profit objective 1 if proprietary momentum continuation signals are not present.
  3. Observe stop-losses to minimize draw-downs

Note: IPM Trade Matrix Trades will be posted in the first half of 2014. This is an experiment to understand and enhance the capabilities of this Matrix.


For Blog updates on Google+ add: Understand Survive Thrive 
For Blog updates on Twitter, add: @survive_thrive
For E-mail updates: 

Sunday, February 16, 2014

IPM Model Update & Gold Breakout

IPM Model Update Has Been E-mailed to Subscribers.

IPM Trade Matrix Updates: IPM Trade Matrix Update - Trade 5 (Part 4)

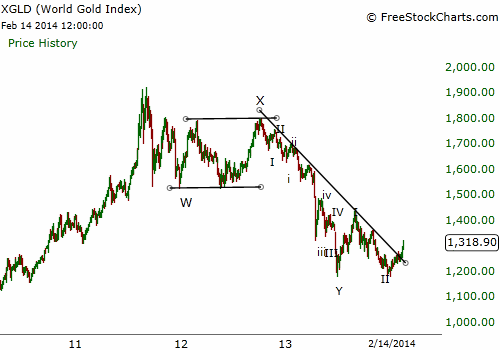
Gold & Silver are breaking out. There are several reasons to be optimistic about their prospects:
  1. 8/4 Test has been completed to the Upside in both Gold and Silver on both dail and weekly time frames. This suggests that the trend has reversed, and we should start looking for upside surprises. 
  2. Long-term trend lines have been broken to the upside.
  3. Sentiment had reached pessimistic extreme few weeks ago, which was in line with a generation precious metal bottom
  4. Bottoming process took its due course which is encouraging for the market
  5. Miners have really started out-performing the metal. This is another exciting and encouraging sign.
  6. Rally from the bottom has been impressive, and suggests a new trend has started.


Confirmation of a new Bull market will be a rally above 1460 in Gold.


For Blog updates on Google+ add: Understand Survive Thrive 
For Blog updates on Twitter, add: @survive_thrive
For E-mail updates: