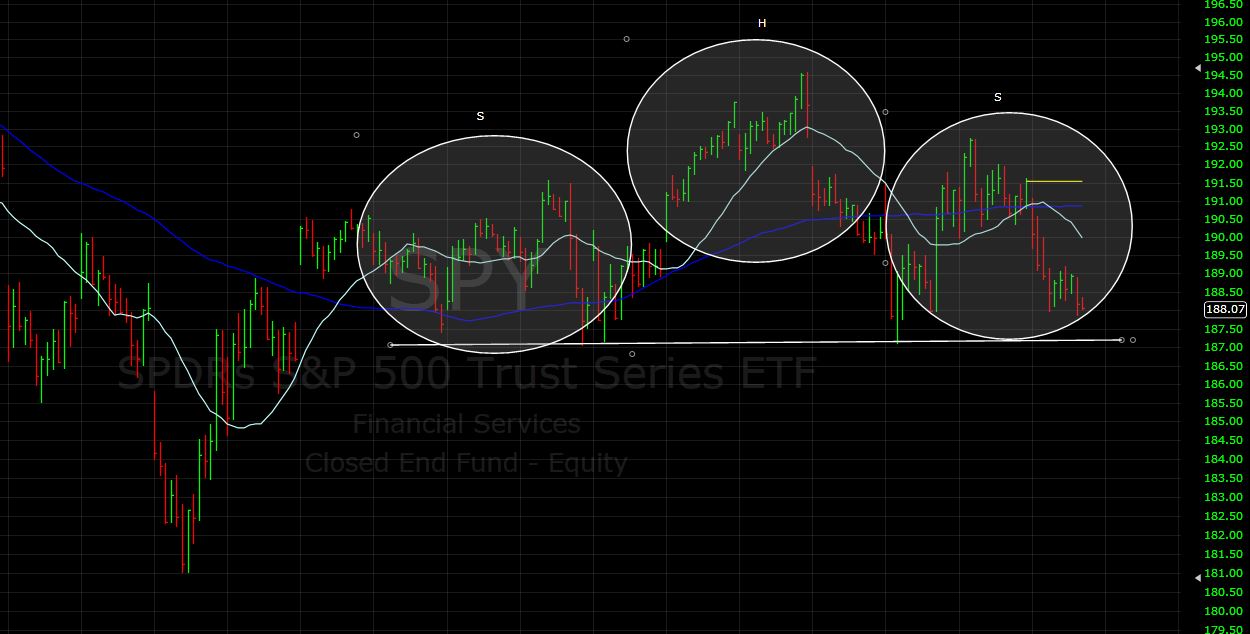
With Federal Reserves not raising the interest rates and Bank of Japan maintaining negative interest rates, the markets are primed for some interesting action. At this point, one must ask:
- Why is the Fed so uncertain?
- What are they seeing that even with stock market (SP500 and DJIA) near all time highs, they are not willing to increase the rates?

We know that the economy is not very strong. And it is a good decision from the Fed to not raise rates. However, what type of signal will it send to the investors? Is it time to be wary of the stocks as the economy struggles or is it time to get aggressive?
The question then becomes, even though the Fed has maintained the interest rates for now, how long can they maintain this posture? Will they not increase the rates on the first sign of strengthening economy? In that case, if the May jobs report comes in very strong, which is expected based on last week's extra-ordinarily strong weekly claims data, will that push Fed over the edge to raising rates at June's meeting?
The question then becomes, even though the Fed has maintained the interest rates for now, how long can they maintain this posture? Will they not increase the rates on the first sign of strengthening economy? In that case, if the May jobs report comes in very strong, which is expected based on last week's extra-ordinarily strong weekly claims data, will that push Fed over the edge to raising rates at June's meeting?
In short, there are so many questions on the fundamental side. Similarly, from a technical perspective there are also several questions. At this time, the best strategy for any individual could be to stay out of the market and wait for the market to show its true direction, which could result in a delayed entry into a good long/short position. Or follow a system that takes out emotion from the investments. Since we have been using the Portfolio Enhancement Algorithm since the start of 2016, we decided to analyze the Q1' 2016 performance.
In the last few blog posts, we have discussed the benefits of Portfolio Enhancement Algorithm based in 2016 based on real-time performance with real money (as of April 12th, model was up ~9%, while SP500 total return index was up ~2.5%.
Following are some additional benefits that we realized by using the model during Q1' 2016.
Following are some additional benefits that we realized by using the model during Q1' 2016.
5.
Trend/Momentum following ability
Model
offers the ability to utilize two of the most basic concepts of investments
that help investors in the long run. In fact, hedge funds, which made a lot of
money in 2015, were momentum following hedge funds. These funds realized that
oil price decline had strong momentum and therefore, continued to hold short
positions in oil.
As long
as one can stay with the trend, investments pay off in the long run. My 8 years
of experience in the financial industry has confirmed the adage that
"Trend is your Friend." If a person tries to fight the trend, it’s
possible that he might make few good trades but in the long-run the investment
account will suffer.
Although
there are indicators and analysis techniques that allow a person to identify
potential areas of trend changes and market timing, there is no Holy Grail.
Therefore, the best option for investors is to stay with the trend. While
staying with the trend, it’s imperative to have risk management facets to guide
one about potential upcoming changes in the market structure.
This is
similar to regular health checks that one undergoes to see how a person is
doing internally. If one doesn't do health checks, they won't get a forecast of
what is going on inside his/her body. As a result, it can be too late when one
reacts to the new developments. In order to mitigate such risks in the
investment world, this model has in-built risk management and market health
check mechanisms.
6.
Positioning for Next Market Move
Another
key aspect related to risk management and market health check is the ability of
the model to position for the upcoming move in the appropriate area. It’s
always critical to position one's portfolio before a move happens rather than
reacting after a move has started. This not only reduces the stress, but allows
one to establish a good position
Since majority
of portfolio gains occur at the start of a new rally phase, if a person waits
for the rally to begin, they might miss on the lion share of the move. On the
other hand, if a person enters too early they might sell before the move
actually starts. As a result, it’s always critical to correctly position the
portfolio for next moves and have confidence in the allocation.
This is
another huge benefit of this model that it allows us to position the portfolio
for an upcoming move without taking too much risk and ensuring enough
diversification with risk management perimeters. As a result of these benefits,
this model can be applied in any portfolio and can be used with leverage to
compound returns.
As an
example, the model allowed us to position in such a way that we benefited from
the Jan/Feb 2016 market decline and then allowed us to mitigate losses through
accurate positioning in March, followed by sharp gains during the last week of
March and first week of April.
- Buy and Hold features
- Quantitative benefits:
- Beta
- Sharpe Ratio
- Alpha