Twitter

Showing posts with label stock market. Show all posts

Friday, August 25, 2017

Market at Crossroad & Potential Catalysts

Over the past few weeks, we are seeing several consolidation patterns popping-up in different markets. Consolidation usually signals in-decision or brief pause before resumption of the underlying trend. However, markets also consolidate in a sequence of 1s and 2s before a significant move in a new direction.

It appears like we are experiencing both the cases in different areas, where market is tracing out a sequence of 1s and 2s, and is waiting for a catalyst to break out of this consolidation. Following charts show this pattern:

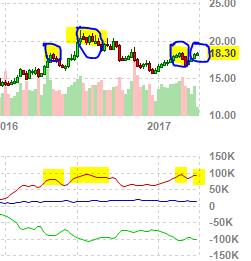
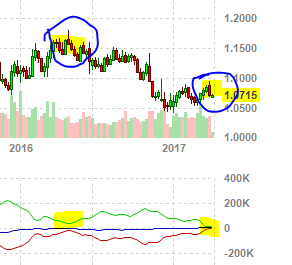
Bonds: Since July Bond prices have been increasing but in an overlapping manner. This suggests that either this is a corrective move and we will see a move down soon, or we will soon see above June highs.


Gold: Over the past 4 days, Gold has placed in 4 inside days above the downtrend line and near the resistance. Inside days show indecision - a point where buyers and sellers are not comfortable making the move. Although most of sideways consolidations result in a move in the direction of the trends, next few days will be telling in terms of the move.


Stocks: SP500 is stair stepping down. Like other instruments, this stair-step pattern would either give way to a substantial decline in the near future or would turn out to be a correction in the broader up trend.

Even though stock market sentiment has come down recently, it remains elevated. On the other hand sentiment for Bonds and Gold is rising but not very optimistic yet. Proprietary timing indicators suggest that next turn date is few weeks away in the stock market. Therefore, if the market declines, other assets could rally but they need a catalyst to move away from current sideways indecision.

Need for Catalyst
Today's Jackson Hole speeches by Janet Yellen (Fed Chair) and Mario Draghi (Chair ECB) could be the catalyst that the market is waiting for.

If it is the trigger and if the markets start moving in 3rd wave out of this consolidation, logical move would be a rally in Gold and Bonds, while decline in Stock Market. Stock market is over-valued and has been rising for over a year, so this move is very possible. A decline in the stocks will be attributed to debt-ceiling debate and numerous other distractions from Washington by fundamental analysis but essentially it will be a natural part of the market rhythm.

We have underscored this observation multiple times that financial news media distracts investors. It can lead to early exit and pre-mature entry into investment positions. As a result, one of the lessons that we learned through 2016 is (Investing Lessons)

Lesson 1: There are no guarantees but being persistent is the key to long-term success

Long-term investing is regarded as the secret ingredient for many successful investors. Time is a very powerful commodity. If you give time to a successful business model or investing strategy, and combine it with dedicated and passionate management team, it will give you amazing long-term results.

Another reason why long-term returns are much more important than short-term returns is because when a portfolio achieve critical mass, one’s personal savings will not have that big an impact on the growth of portfolio. For example: $100K invested today will grow to 1M @ 20% return in ~13 years. At that point 100K will not have as much value because @20% / year an investor will experience a $200K increase without adding any more funds.

Thirdly, investing is a game of nerves and patience, whether in the stock market or any other endeavor like small business, start-ups through Angel/Venture investing, or Private Equity. The only difference with stock market based investing is that you have the opportunity to exit early because the market provides excessive liquidity, which provides peace of mind for many investors.

Long-term investment positioning and persistence provides investor with the focus needed to successfully withstand periods of draw-down because major moves take place after big draw-down periods. We will discuss additional lessons in the next post.

How to Position? 
Most of the readers would agree that the markets are at a critical juncture. However, knowing this is one thing and acting on this information is totally different. So far in 2017, we have mentioned several big moves on this blog and on twitter but doubt if effective trading was performed around this analysis by the readers.

Effective, long-term and consistent trading requires discipline and an edge in the market to adjust findings as market situations change. At this critical time, we are using proprietary models to expose clients to positions that have the highest success probability.  Performance - H1 2017 

Contact
  • Any investment / trading questions: Twitter (@survive_thrive)
  • Free e-mails or Investing: Click on the button below 

Thursday, July 13, 2017

Stocks Approaching Dangerous Levels

Yesterday's rally in all of the major indices $DJIA, $SPX, $EEM, was very well received and triggered many tweets regarding Dow being at all time highs. Even President tweeted that stock markets are doing Great! I would recommend against such tweets because:
  1. What happens when the market goes down? If one owns a rising market, they would have to own the declining market as well, which could be much more negative.
  2. Market risks are increasing and we are close to a turn in the markets, which will correct post-election rally. Hence, a deeper correction can be expected. 
Following analysis supports the correction hypothesis (not a Bear market for now). Please note that below analysis is predictive and unlike mainstream finance, which is reactive, this analysis helps in understanding potential market move before time. This analysis also plays a pivotal role in our client portfolios (H1 2017 Performance has been shared). There are four key components:
  1. Structure
  2. Technical/Divergence
  3. Market Timing
  4. Sentiment
This correction could last for few weeks/months before resumption of the trend because we don't see a Bear market right away. But do you want to be part of a market when its going down and the headlines are negative? Some investment suggestions are included at the end.

Structure
Firstly, the Elliott Wave structure is nearing completion. Once this 5-wave rally completes, we will see a decline. Next decline could bring DJIA back to ~20,500. As for the upside, if current structure (As shown below) holds, Dow Jones Industrial Average cannot exceed 22,000, which is less than 500 points from yesterday's close.


One of the lesson that we have learned over past several years of market analysis is that one cannot and should not blindly believe on Elliott Wave structure without considering the market backdrop.

Divergences
Inter-market divergences highlight discrepancies between markets. These discrepancies typically take place in 5th wave where markets start diverging. We can currently seeing a divergence between SP500, DJIA and Nasdaq (shown below).


Please note that these divergences don't mean that long-term trend has reversed. On the contrary, there are no signals (structural or momentum) that this decline could lead to a new bear market.

Timing
Our proprietary market timing model has a key market turn date scheduled for July 14 (+/- 4 business days). Therefore, we can expect a top by next week.
This model has worked very well in the past and also serves as a key component of our proprietary strategies. We are working on developing a unique trading system around IPM, with potential go-live in 2018.

Sentiment
Following charts show that sentiment is very elevated. 

Long positions in DJIA are at all time highs, which does not bode well for a sustained rally.

Investor Intelligence survey respondents are mired in the bullish region for quite some time, and same is the case with Naaim survey results (charts courtesy of Babak).


Lastly, these two are very interesting.

TD Ameritrade users are very Bullish and are showing it with their trades. Since these are real retail investors, them being so bullish doesn't bode well for the markets.
More than half of E-trade users are also optimistic regarding the prospects of the market, which is another warning signal (Courtesy Noon Six Cap)

Positioning
Markets are at a critical juncture. Preparing for such a decline will depend on personal risk tolerance and tax considerations. Everyone should evaluate their investments through following key investing questions:
  1. Am I ready for a stock market trend change?  
  2. Will I have the mental strength to go against the herd?  
  3. Can I take advantage of new opportunities?
If you think you have too much exposure to stocks, you can reduce some exposure to be able to buy again. If your comfortable taking a hit to the portfolio knowing that you might not be able to enter back in time, it's better to ignore the news and remain invested. Worst thing a person can do is not reduce exposure at top and then get stressed with market/news, ad get out at the bottom, only to see a resumption of the rally.

Alternative Solution: We are helping clients answer above questions every day. And have developed our proprietary strategies to generate consistent returns, while taking advantage of new market opportunities and minimizing existing risk. We aim to provide Absolute Return Hedge Fund like strategies for individual investors through Managed Account model.

Feel free to contact us with any investment questions or if you would like to invest with us (Performance - H1 2017):

  • Twitter: @survive_thrive
  • E-mail: subscription.ust@gmail.com 
  • Comment below
  • You can also sign-up for free email updates below: 

Tuesday, April 4, 2017

Gold Rally Can Pause!

We started investing in Gold in 2016 April, after 4 years of being out of the Gold market. We again increased Gold exposure at the start of 2017, in our proprietary strategies (Jan / Feb
2017 Investment Strategies' Performance). Overall, Gold remains in an uptrend but recent development has made us wary of immediate upside of Gold. 

In this post, we have analyzed Gold's short-term prospects using multiple analysis techniques to showcase the rationale behind our caution:

Technical
After experiences a sharp decline in early March, Gold has rebounded nicely. It is now testing significant trend-lines (show below). These trend lines could act as resistance in the near-term and force Gold to consolidate.


Sentiment
While Gold could experience a pause, it will be a very constructive development. But what is not constructive is the fact that news media has recently turned bullish on the yellow metal. Following are some of the recent bullish Gold headlines:


Furthermore, other sentiment indicators also suggest that Gold and Silver are in for some turbulence. Following chart shows Silver positioning among large and small traders. Current positioning is at levels that have resulted in Silver going down or sideways.

One cannot believe the financial news media because they get behind a trend, once everyone is on board. A detailed analysis of 2016 news and market action is presented here. Therefore, investors need to remain objective in terms of their direction and action plan.
Short-term structure:

With sentiment picture on the optimistic side, its likely that the trend will experience some pause before really asserting itself in the next few days. Above chart shows a potential inverted head and shoulders pattern being formed in Gold. However, the right shoulders doesn't look complete. Some back and forth action will be ideal to complete this structure.  

Gold Influence
Gold is significantly influenced by USD and Euro. Strong dollar pressures the commodities complex. It looks like Dollar has completed a long-term correction since the start of 2017, and could rally for few weeks. Start of 2017 is the same time when Gold start rallying. Once US Dollar rallies, it would be negative for Gold and Silver markets.
Furthermore, Euro long positions are also very extreme, which means that Euro will soon experience correction. Euro decline will also fuel Dollar rise; another reason that could dampen Gold’s ascent.

Conclusion
Gold could experience some resistance around these levels because of technical, sentiment and influence from other areas. However, that doesn’t mean that Gold will not spring back or it has entered a down trend. In financial analysis, one needs to remain objective.

How are we positioning?
We have reduced our long exposure but maintain long positions because Gold remains in an uptrend, as per proprietary Market Classification Model. Details will be shared with subscribers by April 9th. Our conservative proprietary strategy has out-performed the market in 2016 and in Q1-2017 through objective risk-management and a combination of strategic & tactical allocation. Detailed performance analysis will be shared in next 2 weeks.

Want to Invest
You can invest in these strategies through “Managed Account” offering or by subscribing to some of the services like Market classification Model (subscription page). MCM serves as the backbone for our model and can help you develop an understanding of the markets.  If interested in investing, you can register below and we will send an update. 
 

Tuesday, March 28, 2017

Financial Media and Stock Market

Over the last week, Financial News media is talking about how Trump will not be able to keep his promises given current political situation. Hence, continuation of the "Trump Rally," as it has come to be known, is in jeopardy. However, this is not correct and this is my problem with the media. News media needs a story and reports on everything after the fact because that is what majority of their readers can relate to.

They have done the same thing over and over again. Three big examples from 2016 include Brexit, US Elections and Oil crash of early 2016. In case of Brexit and US Elections, media did not have clue of what will happen in the actual vote. Everyone was complacent about status-quo remaining intact and no changes taking place. For example, UK staying in EU, while Hilary winning the White House.


Once both of these predictions turned out to be wrong, they focused on how negative will this development be for the overall stock market because of nationalistic policies, lack of growth and other issues. However, the market proved them wrong every time. And then they cam up with rational behind Trump rally or Post-Brexit stock market rally. These reasons range from additional liquidity by central bankers or business friendly presidency.

Brexit
US Elections
However, if you think about it for a minute, what would have happened had we seen the opposite results in Brexit Vote or US elections?
  • Brexit Vote: A vote to stay as part of EU would have also triggered a stock market rally but the rationale would be - it's a relief rally!
  • US Elections: A vote for Hilary Clinton would have also triggered a market rally with a rational of policy continuation and lack of uncertainty  
In either case we would have experienced higher prices but different rational. Therefore, financial news media had no idea regarding the cause of the rally and didn't know that the market would rally. They just react to market performance and come-up with justifications. If one had been following the financial media and acting accordingly, they would have lost a lot of money or at least had not participated in the market rally.

And right now, media is so focused on negative aspects of Trump administration that it is missing several opportunities. We discussed some of these opportunities, as part of our 2017 investment themes in February (link).

In order to mitigate this news driven emotional roller-coaster, we developed proprietary portfolios, where investors can invest for longer-term consistent gains without involving emotions due to financial news media. For example, we exited the stock market in Sept 2015 and then entered the market again in July 2016, and have maintained long positions since then.

Following is an overview of the performance. Detailed performance will be shared after end of Q1:
  • Conservative: ~7.5%
  • Aggressive: ~18.5%

Want to Invest?

At Understand, Survive and Thrive, our goal is to produce consistent, uncorrelated returns using unique analysis techniques, that will enable your portfolio to beat the market over any economic cycle and provide peace of mind. We don't believe in beating SP500 every single month. And therefore, if someone wants to try our strategies just for the short-term, we will suggest that they will be disappointed at some point.

If you are interested in investing, you can register below and we will send an update. Some of the key outputs from the data models used in this strategy are also available through subscription.

Thursday, March 16, 2017

Next IPM Model Turn Window

After briefly topping at the last turn date of Feb 28, 2017 (link), market rallied yesterday on Federal Reserve's announcement. 

Market Condition

  • During the correction since Feb 28, market did not generate any sell signals. In fact, it generated several buy readings from oversold perspective. 
  • At the same time, Sentiment as subsided in the past few weeks, which will provide fuel for this rally to continue. 
  • From a government perspective, they are busy with controversies and will not be able to influence the market. 
  • Furthermore, Dutch election results were positive for the overall geo-political situation

Hence there are no significant headwinds in front of the stocks right now.

We remain long the stock market because Market Classification Model remains bullish, which turned bullish on stocks in July 2016 and has remained bullish ever since (2017 Investment Performance). However, it is critical to understand potential future turn dates.

According to latest Inflection Point Model re-run, stocks will likely experience turbulence in the first week of April. Following chart shows the IPM model output.
IPM Model turn date is scheduled for April 5 (+/- 4 days). Most likely, this will turn out to be another intermediate top, which will last till majority of companies start reporting their earnings in mid April. However, it will be sufficient enough to make bears out of many longs. 

We will continue to evaluate the market conditions for any sell signals, as we approach this turn date. In the mean time, it seems like this rally could continue for another ~2 weeks.

If your interested in free e-mail list or in paid services like Market Classification Model, please fill-out the form below.

Saturday, February 4, 2017

January 2017 - Performance Review

January was an interesting month for the markets. In the beginning of the month, markets continued to go sideways, which they had been doing for past couple of weeks - since mid December 2016. Then came the earnings and market zoomed higher. Although this rally was not as significant as post election rally in 2016, it did bring back a lot of enthusiasm. The rally continued with President's oath taking. However, it experienced some difficulty towards the end, with the immigration executive order confusion and protests across the United States.

Following chart shows how SP500 performed in the first month of 2017:


To summarize January action, it was a volatile month. Volatility does not only impact our portfolio, it hampers our investment decisions, self-confidence and risk-taking abilities. In order to reduce the impact of volatility and realize long-term consistent results, UST team develop proprietary strategies based on our 8+ years of investing experience, as documented in this blog and other sources.

These strategies went live with real money at the start of 2016. Their 2016 performance has been documented here (link). Our team is currently working on more than 5 strategies. Two of these strategies have moved to production, two are in beta phase and others are in final development phases.  

Investment Strategies

Two strategies (one conservative and other aggressive) will be used for clients' investment needs. These strategies are customized to meet the performance and risk profile needs of investors. These strategies utilized strategic and tactical portfolio allocation techniques, along with proprietary market timing methods to generate Alpha with extremely low correlation with the benchmark SP500. Hence, have very high Sharpe Ratios.

Following chart shows January 2017 performance of Conservative and Aggressive strategies, directly taken from the brokerage account.

Conservative strategy performed 4.53% and Aggressive strategy gained 11.36%, while SP500 was up 1.90% in January.

Performance of these strategies is also tracked on OpenFolio to see daily changes. Following chart shows daily YTD performance for the Conservative Strategy:


Interested ? 

There are two ways to follow and invest in the strategy:
  1. Utilize some of the offerings that UST offers (link). We will officially start sending our Market Classification Model updates in February 2017. And plan to add additional services in the next few months.
Overall, we will actively be working on this blog to ensure that all the services are streamlined. If you have any questions please feel free to comment or interact with the team via Twitter @survive_thrive. Please use the below sign-up button to register for free newsletter or other services:


Tuesday, January 31, 2017

US Stocks at Tipping Point

For readers who want to quickly read about the action plan in this environment, scroll down to the Next Steps section. For detailed understanding of current situation, please read through:

Background

Latest rally phase started in November 2016, around election time. Initially, it was regarded as a relief rally for Hillary could become president as FBI investigation had yielded no results. However, it quickly turned into Trump rally because of promises for stimulus and other pro-business policies.

The popular belief was that the new president will only implement pro-business policies like stimulus and tax cuts, while several other more aggressive policies will not be enacted. Fast forward to today, and the pro-business policies remain elusive while the aggressive policies are causing confusion and in return global equity markets are suffering.

Correction that was due

Blaming the market's decline on policies or some external factors is what TV commentators do. But there is another perspective to looking at this decline. And that is related to the fact that the markets have not experienced any substantial decline since last February (2016).

Following charts shows a nicely persistent rally that had endured over the last year in the face of all the uncertainty of 2016. Both SP500 and Nasdaq show a clear 5-wave rally pattern.


It is surreal to look back at the extremely dismal start of 2016, when people were talking about Oil crash and so many other variables. Even then the market managed to end up ~12% in 2016.

In such a volatile year, our proprietary strategy beat the market and the gained 12.2%. Most of the gains were long-term gains, thus minimizing tax impact (Detailed 2016 performance evaluation).

Therefore, one cannot judge the performance of the market just by looking at couple of months. But one thing is for sure, volatility will be high as overdue correction finally arrives.

No Buy signal, means continued decline

There are several other reasons to believe that recent decline is the start of something bigger:
  1. No buy signal after 2 day decline
  2. Extremely high valuations
  3. Political uncertainty without any focus on economic stimulus programs
  4. Hawkish Fed 
  5. Fairly optimistic sentiment
In order for these stock market rally impediments to go away, market needs to consolidate recent gains. Right now there is no indication that this decline will be the start of a new bear market. However, if the government does not deliver on its pro-business policies, it could quickly turn into one.

Next Steps and Investing Strategies

  1. Keep an eye on the Market Classification Model to understand if and when the stock market enters a Bear Market (MCM Details).
  2. US markets are still in Bull phase and this could be a good buying opportunity, at lower levels
  3. Gold and Bonds can be good alternatives, with careful review of the MCM
  4. Develop an investment plan with your goals in mind and invest accordingly. For example, if you want good returns and have some extra cash, one can buy BitCoins
We will continue to explore 2017 strategic investing ideas on this blog. Forward looking investing helps you in keeping a level head while investing. For example, we mentioned that the market had not entered a bear market in Oct-Nov 2016 and added longs, and ended up benefitting from the latest rally. Analysis during election time:
Therefore, if your interested in free e-mail list or in paid services like Market Classification Model, please fill-out the form below.

Monday, January 30, 2017

Amazing 2016 for UST Proprietary Strategy!!

Happy New Year to all the readers. 2016 was an amazing year with our conservative strategy up 12.2% versus 11.96% of SP500 (with dividend). Snapshot below is taken from the brokerage account.


Introduction

We will start 2017 by reviewing 2016 performance. This review will cover every aspect of the performance, along with how the strategy performed in times of uncertainty and volatility. Each blog post will cover a different aspect of the performance review.

UST team has been developing repeatable, scalable and easily explainable proprietary investment strategies, along with built-in risk-management measures. In 2015, the strategy was developed and back tested. Last year, strategy was moved to production with real money. At the same time, we also developed 3 additional strategies, which will be discussed in future posts.

2016 - The Year of Volatility:

2016 was a very volatile year. It started with one of the worst starts of the year for the US stocks. Although market started a rally phase from Feb/March time frame, it remained on the edge due to following three major reasons:

  1. US presidential election primaries
  2. Fed's rate decision
  3. Brexit 
Brexit was one of the biggest surprises of 2016. The night of Brexit vote, market dropped over 1000 points before starting another rally phase, which most of the market participants didn't see. This was followed by an unprecedented US presidential election, which took almost everyone by surprise. If some people got the election results right, their market positioning was wrong. In the end market ended with a ~12% gain from a ~5% loss at the start of the year.

Conservative Strategy Performance - 2016

Interesting aspect of this strategy is that the returns are uncorrelated with the market. 2016 Beta was -0.57, while 9 year back-testing showed a Beta of -0.08. Since the returns are totally independent of the market performance, we can say that these returns were Alpha.

Throughout this volatile year, our proprietary model kept us on the right side of the trade and kept on adjusting the holdings to dampen impact of volatility, while amplifying potential gains. Following is a snapshot from the brokerage account showing the monthly performance:

Following chart is from Openfolio, showing daily change of the same portfolio in 2016:

Overall gains were impacted by pre-election jitters and post-election bond rout. However, it gave the strategy an excellent buying opportunity, whose benefits we could reap in 2017. We also learned several very important lessons for the strategy, which has enabled us to improve the nimbleness of the model. Benefits of these additions are clearly visible in 2017's performance, which we will discuss in one of the next blog posts. 

Investment Options

We are working very hard to make these strategies available for investors. If you are interested in investing, you can register below and we will send you update when the strategy is available for investments. Some of the key outputs from the data models used in this strategy are also available through subscription

Tuesday, December 6, 2016

November Review and December Forecast

Over the last 2 weeks we have discussed Gold market and the Bond market, in terms of their structure and sentiment, to understand the next rally phase. Detailed analysis can be reviewed here:
As we enter a new month, its critical to quickly review last month and then try to understand where things could go in the last month of 2016.

November 2016

Elections 
At the beginning of November, market experienced a sustained consecutive negative days. This negative behavior, not only tilted the sentiment to bearish and technical indicators to oversold, it also completed the correction pattern. This completion gave way to an amazing rally. We discussed the upcoming rally several times in following posts:
even though few people will remember this fact but the market started rallying even before the election on the news that FBI had dropped the investigation involving Hillary Clinton's e-mail. At that point, people attributed the rally to Mrs. Clinton's impending victory. However, as Mr. Trump won and the market continued its rally, it took many by surprise. 


This tells us that news/economic/political events don't matter. It's the reaction to these events that matter. And one of the best ways to gauge the reaction objectively is by looking at the price structure and sentiment indicators, along with forecasting strategies. 

Correlation with the US Dollar
Even more interesting is the fact that this rally has come in sync with rallying US Dollar. Typically, when US Dollar rallies, all asset classes are impacted. And if not directly impacted, they find it difficult to rally. But following chart shows the amazing correlation between US Dollar and the stock market:


Divergence with Advance Decline line
While this rally has made a lot of market commentators excited about the prospects of a major rally and 2017 with prospects of a major stimulus, this rally wasn't substantial enough to eliminate NYAD divergence.

Divergence in Advance Decline issues is critical for a sustained rally. This doesn't mean that this current rally cannot move much higher, it just means that the near-term rally could face challenges to continue in face of this divergence.

What's Next in December?

In summary, we have credible reasons to believe that the recent stock market rally is extended and we could see a market correction over the next 1-2 weeks (probably till next IPM turn window). While Stocks market corrects, asset reallocation can take place with money flowing into oversold sectors like Gold and Bonds.

Since US Dollar is also extended, a correction in the Dollar index will also support Gold rally. On the other hand, Fed FOMC meeting and an announcement to increase the short-term rates can also reduce some of the uncertainty from the Bond market, which could result in reprieve rally for Bonds.

Market might resume its uptrend in the 2nd half of December. However, the velocity of the ascent might not be as significant, as it has been in November.

Lastly, for Gold it is a do-or-die point. It needs to rally above 1205 in the next few weeks or it will likely enter another bear market.

If interested in free e-mail list or in paid services, please fill-out the form below.


Wednesday, November 30, 2016

Bond Market Buy Signals

After experiencing a sharp decline in the last ~2 months, bond markets is now consolidating. In fact, today it managed to rally above a critical level. If bonds can hold near this level for the next few days, intermediate trend would turn up.

This decline has resulted in multiple bond indicators turning bullish i.e. sentiment turning so pessimistic that it is now bullish. Three widely followed sentiment indicator readings are given below:

1- Hulbert Sentiment Index:
The blue line below represents bond yields. Bond yields move in the opposite direction to the bond prices. Red line indicates the sentiment towards bonds. At this point, it appears that the sentiment is as negative as we have seen in ~2 years. Therefore, there is a good wall of worry to support a bond rally.

2- Bund Sentiment
Bunds are German bonds. Bunds were among the bonds that went into negative yield territory. While they were negative, everyone was bullish on the future of Bunds. However, very few realized that it was more close to the end of the Bunds rise. On the contrary, right now investors are very bearish on Bunds. This suggests that this a good time to increase exposure to bonds
3- Bond Sentiment NDR indicator
According to NDR services, bond sentiment is now extremely pessimistic, which supports the argument that the Bond decline is over-extended and we should anticipate a rise in Bond prices:

Bond Market Trend
While we are seeing some very pessimistic sentiment readings, these are coming at a time when the Bond market remains in a bull market according to our proprietary Market Classification Model. Therefore, the prudent trade right now would be to add or maintain longs in the bond market.

Keep in mind that bond market has been rallying for over 30 years, and yields have been declining for the same period. This trend will eventually come to an end. The question is whether it has already ended or will end with one for decline.

In either case, bond yields will not go up right away. They will go up if the economy continues to improve and Federal Reserves raises interest rates couple of times. Fed's changes to short-term interest rates does not directly impact the longer-term interest rates because those rates are driven by market expectation.

In the next blog post, we will discuss the bond market structure and both Bull and Bear scenarios. Poor bond market is in no one's favor and the central banks will try their utmost to ensure interest rate rise remains in control. From an investment perspective, we might see 1 or 2 more opportunities to fund big capital purchases at a lower interest rate.

If interested in free e-mail list or in paid services, please fill-out the form below.

Monday, November 14, 2016

Bonds Market Analysis and Impact

After a dynamic and super-charged start of 2016, the long-term bond prices, as measured by TLT, are at the same level where they started the year - 120.6 vs 120.7 (shown below).

 
Above chart shows the amazing ascent and first six months and the sharp decline over past 4 months. Today's news is full of negative articles about the bond market rout, and potential consequences.

Bond market is the life blood of modern economies. There is hardly any developed country in the world that is debt free. Countries issue debt/bonds to implement development projects and repay any interest/payments that are due on existing obligations.

United States is a unique case where the government cannot just keep issuing bonds to raise money without any checks and balances. These checks and balances help keep the government debt in control, which supports the dollar and increases confidence among the lenders that they will get their money back.

This check/balance process is known as the debt-ceiling. Without confidence in the system, creditors might start hesitating in purchasing government treasuries, which could lead to higher bond yields, making it more difficult for US to finance future needs.

Orderly, rise and fall of treasury yield is very normal because it is governed by economic realities and Fed's actions. But sudden sharp rise, can be catastrophic for the overall economy. That being said, we are in a long-term downtrend in the bond yields, which will reverse one day in the near future.

Long-term view
In early 1980s, long-term treasuries were yielding 14%. They went as low as 2% in July 2016 - amazing time to refinance or make a big purchase at next to no interest rate.

However, this kind of decline will not last for ever. Typically, there is a ~30 year bond market cycle and right now we are near the bottom of the yield cycle. Following chart shows the yield decline structure.


Now the question is whether this trend has ended or does it have one last decline left in it? 

From a fundamental perspective, it is difficult to rationalize how the inflation can pick-up with oil, gold and other commodities being hit with higher dollar. If dollar rallies, it will pressure inflation and as a result, yields would come down.

Short-term View
From a short-term perspective, bond market has become extremely oversold. The sentiment is conducive to a sharp rally, as investors start to rationalize higher yields through new post-election economic realities. DSI sentiment is also extremely subdued.

Note - Election or no-election, economic realities don't change randomly. Rather, their interpretation changes but in the end everything cancels out in the direction of the primary trend

Following chart shows the near-term structure of the bond market. There are two ways to decipher this structure, but both ways suggest that this is a corrective structure. Below chart shows both the wave counts.


We will continue to monitor the bond market as we approach next month's Fed FOMC meeting. Fed might not raise the rates after an election surprise, which could give a boost to bond market.

Last Word
A collapse of the bond market will be a very bad scenario for investors and the economy. Abrupt rise in interest rates can destroy US abilities to pay existing obligations and could lead to a significant market impact. This impact might start from the US but could quickly spread through out the world. And once such a spiral starts, it is almost impossible to halt it in the middle.

If you are an investor with a substantial portfolio in bonds, you need to carefully watch for trend change in the bond market. Our proprietary Market Classification Model remains in a bull market for Bonds.

If interested in free e-mail list or in paid services, please fill-out the form below.