
Q1 2018 has been very interesting. We started the year after an amazing 2017. In fact, we said the following words to define 2017 performance in Jan 2018:
"2017 was a very unique year with respect to market performance. SP500 was up for every month of the year, a very unusual occurrence. When one combines this amazing performance with extremely low volatility, it gave us a Sharpe Ratio of more than 3.5. To be honest, if one can get a Sharpe Ratio of 3.5 from an asset class like SP500, one should never invest anywhere else.
"2017 was a very unique year with respect to market performance. SP500 was up for every month of the year, a very unusual occurrence. When one combines this amazing performance with extremely low volatility, it gave us a Sharpe Ratio of more than 3.5. To be honest, if one can get a Sharpe Ratio of 3.5 from an asset class like SP500, one should never invest anywhere else.
However, the problem is that the historical Sharpe Ratio of the US stock market from 1928 to 2016 is 0.4. This means that last year's performance was an anomaly and will likely not be repeated in the near future. Therefore, one needs to prepare for more volatile, low performance markets over the next few years."
However, Q1 2018 has confirmed our hypothesis that 2017's performance was an anomaly to be replaced by extreme volatility. During Q1 2018, both of our proprietary strategies have performed very well while market has experienced amazing volatility. As you know, our goal is to generate value for investors not just try to beat the market every day because beating the market everyday carries risk and additional tax/transaction costs. We have been delivering value for clients in following 4 ways:
However, Q1 2018 has confirmed our hypothesis that 2017's performance was an anomaly to be replaced by extreme volatility. During Q1 2018, both of our proprietary strategies have performed very well while market has experienced amazing volatility. As you know, our goal is to generate value for investors not just try to beat the market every day because beating the market everyday carries risk and additional tax/transaction costs. We have been delivering value for clients in following 4 ways:
- Consistent / Absolute returns comparable to major stock indices
- Uncorrelated performance - Deliver Alpha under different market condition
- Differentiate by deploying techniques not used by mainstream investment gurus
- Provide a unique market perspective

Q1 Market Recap
2018 started with an outstanding January with SP500 (TR) rallying more than 5.7%. During the same time our conservative strategy under-performed the market, while aggressive strategy out-performed. January confirmed what we hypothesized in the beginning i.e. our strategies are not designed to beat the market every month. This is very important to know because understanding the investment strategy increases confidence.
At the end of January, we received a sell signal in the stock market. This sell signal allowed us to end our long positions after ~2 years and build a very small portion of short positions. This sell signal played out very well as we moved in to February because we saw a sharp decline of more than 10% in major US indices. This decline caught many investors off-guard. However, the ensuing rally again increased the confidence of the bulls. During the rally phase, we continued to highlight the dangers of the rally, internal dynamics and IPM turn window with a suggestion that markets could top in early March.
We don't think the volatility will subside right away. We could see another leg down because the sell signal still remains in effect. With this backdrop of events, everyone should ask themselves if their portfolio is positioned to absorb increased volatility, and better yet, can they benefit from volatility. .
In order to properly and profitably navigate through markets where extreme gyrations and news driven moves are the norm, one needs to maintain composure. Our strategies don't depend on market news, rather take into account underlying market tones to make investment decisions. This reduces transaction cost, dampens volatility, moves taxes to long-term bucket and generate consistent results for long-term benefits.
Portfolio Strategies
We currently have two live strategies, and are working on 3 more strategies in Beta phase. Goal for both of these strategies is to generate absolute, uncorrelated returns:
- Conservative (EPSB): Suitable for retirement accounts and risk-averse investors
- Aggressive (AEPSB): Suitable for risk taking investors, with longer-term invest goals
Note: Following strategy performance numbers do not include fees.
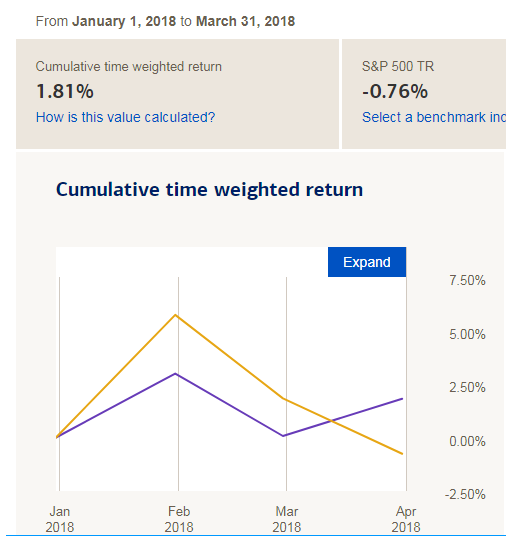
Conservative Strategy: 1.81% vs -0.76% for SP500 (w/ dividends)
In 2018 conservative strategy has out-performance SP500 and had a negligible correlation with SP500 monthly returns. This low correlation is also evident from performance since inception data.
Aggressive Strategy: 2.97% vs -0.76% for SP500 (with dividends)
Aggressive strategy has significantly outperformed SP500 so far in 2018. And the R-sq correlation coefficient is 0.03. In other words, our performance was independent of SP500's performance.
Conclusion
The best aspect of these strategies is that they enable the investor to concentrate on the work that is more important in life than losing sleep over investments through daily news because we do the research and invest using proprietary algorithms. If an adviser or fund manager cannot generate uncorrelated returns, investors are better-off investing in a standard passive fund. But if the manager can generate uncorrelated performance, they generate Alpha. And successful managers are compensated for generating Apha.
These strategies are open for investment. Please feel free to contact via subscription.ust@gmail.com for details. These strategies are being implemented via managed account setup through a Registered Investment Adviser. As a result, you keep control over your assets.
Please contact us for details. You can also sign-up for free email updates below:
