Twitter

Showing posts with label Elections. Show all posts

Saturday, October 22, 2016

Sideways Gyration Continues...

For more than 3 months markets have been going sideways. This sideways action is not only boring, its very straining for investors, economists and everyone else. As market goes sideways, investments don't yield returns which frustrate investors and they try to do things that more often than not hurt them. It's a way of market to throw us off our investment strategy. But the goal is to be not be dissuaded by the market and keep following a plan.

Along side regular investors, it significantly impacts options traders. Sideways market action is disastrous for option premium. As a result, options expire worthless. SP500 is currently at the same level as it was in early July. So over last 3 months, market has not gone any where.


If anything, it has a slightly downward trajectory since August. On one hand, this kind of market action is positive for long-term market gains, as market is digesting gains and will most likely breakout, it begs the questions whether we have seen the bottom or market still needs to do some work on the downside.

We are blessed to be up ~20% (YTD), while SP500 is up ~6%. Detailed performance analysis will be shared at the end of the month.

Identifying Next Market Move
Identifying a top or bottom remains a very difficult job. In order to correctly project market's next move, we need to take into account 4 items:
  1. Timing
  2. Structure
  3. Market Signal
  4. Confirmation
Without all of the above items lining-up, its premature to assume that trend has reversed.

Timing
In regards with market timing, we are currently within the Inflection Point Model's turn window. Window is shown above in blue box and is shown below:
Turn window will expire at the end of next week.

Structure
Market structure remains corrective but there is a potential that we can see a decline before sustainable rally. Therefore, if the market rallies and can sustain the rally, it will be signal of bottom. If the market cannot sustain the rally and starts declining in the next couple of days, it will suggest more work is needed on downside. 

Market Signal
If market performance over the next few days generates a technical signal, it will show us whether market will top or bottom within this turn window

Confirmation
Once the trend is set, we would need a confirmation by proprietary levels to confirm the move.

Conclusion
Market remains in a sideways pattern. This pattern will soon end but will confuse many market participants along the way. At UST, we know that the market is within a turn window, now we just need to wait for a market signal and confirmation to confirm the next move. 

Overall, market remains in an uptrend. And in the next post we will see the value of adhering to Market Classification Model. We will also be writing a series of posts on how our proprietary strategy fared in a confusing sideways market. This will be an amazing case study and I am thankful for the fact that we have seen this kind of market action because it will enable us to see the benefits of certain key aspects of our strategies.

If interested in free e-mail list or in paid services like Market Classification Model, IPM or others, please fill-out the form below.

Wednesday, October 5, 2016

September Performance Recap

September was a volatile month in the markets.

If you look at the SP500 chart, it has been going sideways and frustrating many market participants.


As we mentioned in the last post, pretty much all the major asset classes have experienced sideways action over past month.

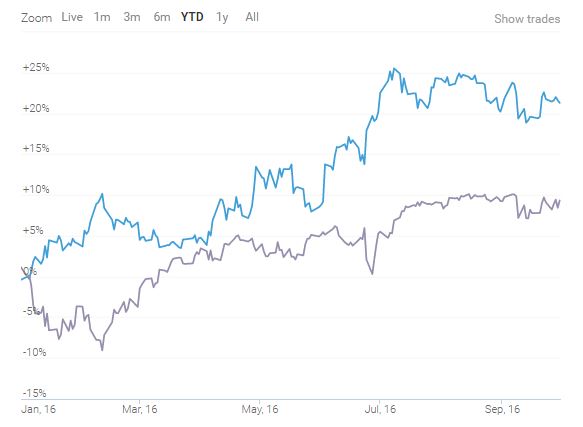
2016 has been a volatile year so far with markets declining sharply in Jan and February, followed by a nice rally. During these volatile times, our proprietary strategy has out-performed the SP500 by 16.3%.

SP500 Performance (Jan - Sept) = 7.8%
Conservative Strategy (Jan - Sept) = 24.1%

Cumulative performance since January in relation with SP500 (total returns) is shown below:


Monthly Performance: 

Following chart shows monthly variation in performance.


Model is agile enough to take advantage of trend changes and re-allocate in strategic positions prior to big market moves.

All of these returns are for a portfolio whose current Beta is 0.32 and whose YTD Beta is -0.57, which means that these returns are totally uncorrelated with the market. Therefore, portfolio has a very high Alpha.

If interested in free e-mail list or in paid services, please fill-out the form below.


Sunday, October 2, 2016

September 2016 - Market Recap

September was a volatile month for all asset classes, as it started with a sharp decline in Stocks, Bonds and Gold. We will discuss these assets below and will leverage this information for October forecasts.

However, need to highlight that last IPM turn window was scheduled for September 26th. Market has made a bottom on September 26th and it's possible that we will see a sharp rally in the next few weeks. We will share details on the IPM turn window in next couple of posts. We are already positioned in our aggressive IPM based strategy to take advantage of this date.

Bonds

  • Since the start of September, Bonds experienced severe decline
  • Decline brought out the bears, as expectations of an impending FED rate hike increased
  • The decline was so severe that at one point, TLT has decline -4.4% by mid month
  • This decline was followed by a sharp rally to near break-even levels for the month
  • In summary: A lot of volatility but no real action / direction, which is apparent from following chart

Stocks

  • Stocks opened September slow but soon after the long weekend and on the heels of a strong jobs report took a nose dive

Gold

  • In contrast to Stocks and Bonds, Gold started with a sharp rally. However that rally fizzled out
  • Since then, Gold has been going sideways. There are two options for the Gold in the month of October:
    1. Gold and precious metal complex has already bottomed and will soon rally to new highs
    2. Gold has traced out a triangle and will decline in October, to mark a bottom
  • Both of the above scenarios suggest that the metal will be higher in future months. The question is whether it will take a detour to lower prices before rallying


Summary

  • Consolidation is the name of the game
  • Overall SP500 gained +0.02 %, Bond lost -1.7% and Gold gained 0.7%
  • We will soon see a well-defined trend but volatility might continue till Presidential elections in November.

Upcoming Blog posts:

  1. Strategy Performance - September recap
  2. Forecasts for October
    • Stocks - Elliott Wave and IPM Model
    • Bonds - Structure and relationship with stocks
    • Gold - Long-term targets and patterns
  3. Performance of Options strategy based on IPM Model

If interested in free e-mail list or in paid services, please fill-out the form below.


Thursday, September 22, 2016

Federal Reserves and Market Action

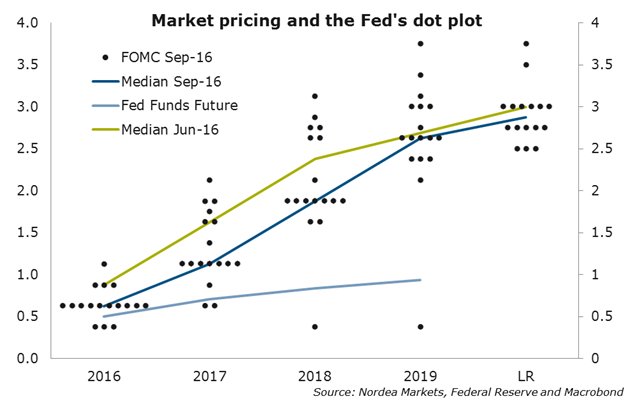
The Fed announced holding the rates and provided guidance for potential increases in future. It wasn't anything out of the ordinary. It was highly unlikely for the fed to raise rates at such time before the elections. However, the more interesting reading came from the dot-plot.

Fed uses this plot to provide guidance regarding future interest rate path. Median of the dots show a curve where Fed officials believe interest rates should be over the next few years.

Following chart shows the plot:


Along with the dot plot, above chart also shows the median projections for the next few years as taken in June and September. As one can see these estimates have come down a lot. As a result, the expectation of interest rise have also decline.

Once this expectation declines, it gives was to higher bond prices and lower yield. At this time, higher bond prices would mean more liquidity, thus being favorable for the overall asset class complex. This situation will surely change one day. For now, we are in an uptrend. In yesterday's analysis on Pre Fed and Bank of Japan announcement, we shared same outcomes

Market Classification Model has been bullish on Bonds for years now. And it seems like there is no reason to bail-out on bonds just yet. Even though many financial gurus have been predicting an inevitable bond demise, which will happen one day, current situation is supportive for a bond rally. As long as trend remains up, forecasts for bond collapse will not come to fruition. Therefore, it's imperative that one remains with the trend.

At Understand, Survive and Thrive, we use Market Classification Model to stay aligned with the trend. MCM is an algorithm based on some of the most time-tested market indicators and their inter-relations to determine when the trend changes, so that we don't stay on the wrong side of the trend for long.

If interested in free e-mail list or in paid services, please fill-out the form below.