Twitter

Showing posts with label Bull Market. Show all posts

Thursday, February 23, 2017

Market Behavior and Impact on Gold


Market Overview

Markets have rallied very significantly. First burst of the rally was after election till mid-December and the second burst has been from end of January till today. Impressively, our proprietary Market Classification Model remained long stocks during this entire period. Model turned bullish soon after Brexit and has remained bullish since July’16.

Although in the hindsight one can easily say that the market rallied and it was prudent to remain long throughout this time, most of the market participants did not stay long. In fact, there have been significant bursts of pessimism during this rally. For example:

  • Brexit induced anxiety
  • Election related stress
  • Post-election disbelief
  • Post Executive orders convolution

However, these kind of market panics are the very reason why this market has been able to rally this far – Market likes to climb a wall of worry.

Now that stocks have rallied sharply over the last two weeks, we are approaching a period of consolidation. Consolidation doesn’t mean a sharp decline rather a period of sideways action like we saw in January, to digest recent gains. A potential scenario is market topping towards the end of February, according to Inflection Point Model and then consolidating till next earnings reports to justify high prices.

Once this consolidation phase arrives, other assets like Gold are likely to outperform.

Gold

Gold has been consolidating for some time. And this consolidation is supported by a series of higher highs and higher lows, which means that the next stage rally could be very significant. Gold also remains in a Bull market and would be an ideal candidate for a continued rally.

Following chart shows Gold performance over the past 2 months, where a steady uptrend is clearly visible.

 
Gold stocks are also tracing out higher highs and higher lows. In fact, following chart shows a potential head and shoulders pattern being crafted out by the Gold stocks. Once this pattern is completed, Gold miners can easily make a run for the summer 2016 highs.


 Latest MCM report included details about Gold’s uptrend and where the trend is with respect to the overall bull market.

Upside potential is further amplified by the fact that Gold performs very well in an inflationary environment and with rising interest rates, we are likely entering an inflationary environment.

If your interested in free e-mail list or in Market Classification Model, please fill-out the form below.


Tuesday, February 7, 2017

2017 Investment Themes

There are many prominent investment themes for 2017. Investment themes help investors understand the broader investment landscape based on historical performance of different asset classes and their current catalysts. This analysis helps in properly positioning one's portfolio to take advantage of the winds of change.

US Stock Market

SP500 and DJIA have experienced an amazing 1 year rally. Since Feb 2016, markets are up ~30%. With such a sharp rally, it won't be wrong to expect a sideways/downward market correction. Since corrections can come in different forms, sideways correction with time will help in digesting last year's gains just like a sharp fall in prices.


Lofty price levels can be supported by equally good earning numbers, which can provide further fuel for the rally. However, with the uncertain political dynamics in the U.S. we should be prepared for any sudden decline in the US stock prices like 1987 market crash - not a certainty but a word of caution.

Note: Next earnings will be reported in mid-April 2017


Emerging Markets

On the other hand, emerging markets finished a 5 year long correction in 2016. As US markets rallied, emerging markets corrected from 2011 to 2015. Since bottoming in 2016, emerging markets have rallied and looks like they have formed an inverted head and shoulders pattern. Once they breakout, emerging markets could go up to there 2011 highs. Therefore, this is an area to keep in mind.


Precious Metals

Gold had been declining since 2013. It bottomed in early 2016 and then rallied sharply. However, since mid-2016, Gold has again experienced a major pullback. However, we think that this pullback is a buying opportunity and would result in higher prices. 

Following chart shows a potential inverted head and shoulders pattern being formed by gold. Once this pattern is complete, gold can make an advance towards all-time highs around 1900. However, the first target would be to reach July 2016 highs. Therefore, gold is an area which one should keep on his/her radar for investment opportunities.


Precious metals are also influenced by the US dollar. US dollar has rallied very significantly over the last two years or so. Therefore, as the US Dollar corrects, it will provide fuel for a rally in the precious metals complex.

Bonds

Bond have been in a long-term bull market. In fact, its one of the biggest bull markets in history of bond prices. However, the bond price cycles are turning and so are the prices. Now the question is whether the Bond Bull has ended or it still has some life left.

Bond prices started declining in mid 2016 and have reached a critical area. Prices should reverse to the upside soon or they will mark the end of the Bond bull, which can be disastrous for the debt-laden global economy. We will keep a tab on the Bond market to understand clues for the future of the US economy.


Investment Options

We are working very hard to make these strategies available for investors. If you are interested in investing, you can register below and we will send you update when the strategy is available for investments. Some of the key outputs from the data models used in this strategy are also available through subscription

Saturday, February 4, 2017

January 2017 - Performance Review

January was an interesting month for the markets. In the beginning of the month, markets continued to go sideways, which they had been doing for past couple of weeks - since mid December 2016. Then came the earnings and market zoomed higher. Although this rally was not as significant as post election rally in 2016, it did bring back a lot of enthusiasm. The rally continued with President's oath taking. However, it experienced some difficulty towards the end, with the immigration executive order confusion and protests across the United States.

Following chart shows how SP500 performed in the first month of 2017:


To summarize January action, it was a volatile month. Volatility does not only impact our portfolio, it hampers our investment decisions, self-confidence and risk-taking abilities. In order to reduce the impact of volatility and realize long-term consistent results, UST team develop proprietary strategies based on our 8+ years of investing experience, as documented in this blog and other sources.

These strategies went live with real money at the start of 2016. Their 2016 performance has been documented here (link). Our team is currently working on more than 5 strategies. Two of these strategies have moved to production, two are in beta phase and others are in final development phases.  

Investment Strategies

Two strategies (one conservative and other aggressive) will be used for clients' investment needs. These strategies are customized to meet the performance and risk profile needs of investors. These strategies utilized strategic and tactical portfolio allocation techniques, along with proprietary market timing methods to generate Alpha with extremely low correlation with the benchmark SP500. Hence, have very high Sharpe Ratios.

Following chart shows January 2017 performance of Conservative and Aggressive strategies, directly taken from the brokerage account.

Conservative strategy performed 4.53% and Aggressive strategy gained 11.36%, while SP500 was up 1.90% in January.

Performance of these strategies is also tracked on OpenFolio to see daily changes. Following chart shows daily YTD performance for the Conservative Strategy:


Interested ? 

There are two ways to follow and invest in the strategy:
  1. Utilize some of the offerings that UST offers (link). We will officially start sending our Market Classification Model updates in February 2017. And plan to add additional services in the next few months.
Overall, we will actively be working on this blog to ensure that all the services are streamlined. If you have any questions please feel free to comment or interact with the team via Twitter @survive_thrive. Please use the below sign-up button to register for free newsletter or other services:


Sunday, November 27, 2016

Gold Market Sentiment & Structure Confluence

In the last post we suggested that the trend in the Gold market is about to exhaust itself based on structural analysis (link). Since then the gold declined for a day and helped solidify the pattern, along with pessimism, necessary for a sustainable bounce.


Gold Sentiment
Gold sentiment has dipped to levels last seen near last year's lows. Following snap shots are from Daily Sentiment Index values on Nov 21.


Following chart shows longer-term DSI values (originally published by Taylor Dart). We can see that DSI is at lowest levels seen in last year.
Gold miners are also extremely oversold. They are at levels where we have seen major bounces in the past. This bounce can turn into major rally, dependent on internal market strength.

Hulbert index also shows that the sentiment is now negative 18%, which means that the average newsletter writer is now recommending shorting gold. Even though it is not at the lowest level, we have seen higher lows in the sentiment at the bottom. So it's possible that gold prices might bottom with a little elevated sentiment.


Market Classification Model
Along with all the positive developments on the sentiment front, the Market Classification Model remains in a bull market for Gold. As a result, we should not only expect a bounce but a resumption of the uptrend. This resumption could lead to acceleration to the upside. If the market completes the inverted head and shoulders pattern, we could easily see 1800 in 2017.

In the next blog post, we will discuss Fundamental reasons that could support this rise in Gold prices including asset rotation and Indian decision to restrict currency.

If interested in free e-mail list or in paid services, please fill-out the form below.


Tuesday, November 22, 2016

Gold Market - Approaching a Turn

Gold market has been declining for the past few months. This decline came after a very sharp start of the year rally in Gold. Based on gold market's fundamental, technical and sentiment analysis, Gold is approaching a bottom. From a technical perspective, there are three distinct reasons that point us towards an approaching Gold market bottom:

  1. Intermediate term Gold structure
  2. Longer-term goal structure
  3. Market Classification Model
Intermediate term Gold structure
Gold prices topped in early July. The peak in Gold prices coincided with Brexit panic. Since topping in July, prices have gone down in a choppy manner - characteristic of a market correction.

Even though Gold prices spiked on US election night, they went down and have declined since then. If we look at a slightly longer-term pattern, it seems like that the recent decline is part of a big corrective pattern that started in May. 


As a result, this correction will be wave 2 of the rally that started in Dec 2015. Once this wave ends, we will be in for a very sharp rally in wave 3. This rally will most likelt take the prices to near the all time high. Another evidence in this regard is the inverted head and shoulders pattern being carved out by the precious metal:

Inverted Head and Shoulders
Following chart shows weekly Gold prices over last few years. Once can see a nicely formed inverted head and shoulders forming. Once this pattern is completed, it's target is around 1800 level.


Other reasons to support the fact that Gold is approaching a major bottom is the pervasively negative sentiment as evident from Daily sentiment Index, Bullish Percentage Index or Hulbert Gold Newsletter Index.

Market Classification Model
Our proprietary Market Classification Model remains in a bull market. MCM utilizes prop trend identification algorithm to decipher between bull and bear markets. Currently it is in a Bull market. It entered a Bull in April and has maintained its posture since then. We use MCM to make investment decision and add positions.

In the next blog post, we will review sentiment analysis for Gold and fundamental reasoning for a gold rally.


If interested in free e-mail list or in paid services, please fill-out the form below.


Wednesday, November 2, 2016

Market Trend Remains Up

Sideways consolidation continued over the last week. The blog wasn't updated because of registration paperwork. We will discuss Investment Advisory registration in one of the upcoming posts.

Markets' sideways action remains intact. Even though in the last couple of days SP500 and US indices saw a relatively sharp decline, it did not impact the overall shape and form of the market.

Market Structure
SP500 is tracing out a diagonal pattern (shown below). One of the criteria of this pattern was to decline below C level, which it did yesterday. Now, the market needs to hold above yesterday's bottom to confirm that this pattern has been completed.


The overall market structure remains very choppy. This choppy action now spans over 4 months, which is a good enough time to correct the market through time. At weekly level this sideways action looks nothing more than a bull flag or pennant formation. And both of these are bullish in nature.


In terms of next market move, there are couple of options and will be determined by how the market participants react to the next rally phase. In either case, the minimum rally requirements would be above July 2016 high or around that level (SP500 = 2190).

Sentiment
Recent decline has also improve sentiment measures to suggest that a more sustainable rally is possible.

Fear/Greed indicator is at levels where it typically signifies a market bottom.

Similar another indicator just generated a buy signal and could mean that the trend is about to turn to the upside.


Market Classification Model:
MCM for stocks continues to be in a bull market. Therefore, the trend remains up and we will soon see a sharp rally. Even with yesterday's sharp decline, our strategy performed well. While SP500 was down 0.72%, we were up 0.20%. Another proprietary model is suggesting a sharp rally in our strategic allocation portfolio. We will see. So far by the grace of almighty, our proprietary portfolio is up ~20% YTD (after 10 months), which SP500 is up ~6%.

 If interested in free e-mail list or in paid services, please fill-out the form below.


Tuesday, October 25, 2016

Inflection Point Model - Performance Recap

Inflection Point Model predicted a market turn date on Oct 21, 2016. Market declined on the 21st and then rallied. The rally continued today and futures are up now. With new catalyst along the way in the form of earnings from Apple and Google, we can expect more gains. Good thing is that even with today's very powerful rally, there was no sell signal. This suggests that the trend remains intact and is strong.

IPM Output - Turn date 10/21/16
Following chart shows the IPM model's output, as shared on Oct 17th (link)
Market Structure
Analyzing IPM model in conjunction with the market structure showed us that the trend had been sideways to down since mid July. Hence, the likely scenario was for market to put in a bottom during the IPM turn window and rally.

Following chart shows the latest structure shared on the blog along with a blue box, highlighting potential market turn window.


Following chart shows performance of SP500 as of today i.e. after bottoming within IPM turn window on Oct 21, one can observe the green bar with a gap up. Today's performance shows that the market gaped-up but did not cover the gap, hence, hinting towards a strong move. At the same time, confusing so many market participants, who have been taking failure of rallies as the new norm. 


Next Steps
We will continue to evaluate the market with respect to its structure and Inflection Point Model. One of the biggest benefits of the IPM model is to forecast potential market turn dates. And when IPM turn dates are combined with Market Classification Modal, it paints a much clearer picture. 

Market Classification Model is bullish. Next run of the model will be in next few days. Once the model is processed, it will tell us whether the internal strength of the market justifies a continued bullish posture or should one be wary of market trend changes. This information will be shared with subscribers immediately, so that they may evaluate their long investment positions.

Tomorrow's market Action
So far the futures are up and we could see a  continuation of the rally. This rally has a lot going for it but there are some signs of tiredness appearing in the market. We will evaluate the market structure and next IPM turn window in upcoming posts.

If interested in free e-mail list or in paid services, please fill-out the form below.

Tuesday, September 20, 2016

Technology getting ready for a Break-Out

While the US markets have been going sideways, Nasdaq has traced out an inverted head and shoulders near all time highs (shown below):

These highs are 16 years old and there is vacuum above this level. If this pattern holds, we can expect a sharp rally in the near future. This rally can start in parallel with central banks announcements or it can start after a decline following Federal Reserves announcement. In any case, this is a very positive development for the market.

If Nasdaq can lead the market, we can be sure that the overall market will follow and that the recession talk will substantially subside. According to Market Classification Model, we remain in an uptrend. Uptrend typically results in rallies and market participants find reasons to be bullish even in front of negative news.

If interested in free e-mail list or in paid services, please fill-out the form below.


Monday, September 19, 2016

Market Review and Next Week

After a sharp decline on September 9th where Dow dropped almost 400 points, market went sideways last week. Although the net result was sideways action, extreme marker moves were witnessed. Monday opened negative and then markets rallied hard, while Tuesday saw a sharp sell-off.

As the week came to a close, the volatility and market range had reduced. In fact, market closed +0.5% for the week. Following chart shows gyrating market behavior of last week.


While SP500 and DJIA consolidated towards the bottom of the range, Nasdaq 100 powered to near all-time highs, primarily driven by Apple stock and the demand for the new iphone and Samsung issues. QQQ are now very close to all-time highs!


One thing that we have said many times on this blog is that the market trend determines how the market participants and investors react to headlines. This weekend there were many reasons to sell the market, ranging from bomb blast in NYC to other events in Syria (US and Russia tension). However, if we are in an uptrend all headlines will be interpreted in a positive manner and resolve to the upside.

According to Market Classification Model, stocks remain in an uptrend. And that's the reason why we have neither sold our stock positions nor are planning to sell them till the model turn south. At this point, it will take a sustained substantial decline to do so. However, past week's decline has created enough selling extreme without really damaging the internal structure, that one can treat it as a minor correction in an uptrend.

Next Week
In the coming week, there are many reasons stories that could move the market. Top two news events will be:

  1. Fed FOMC meeting
  2. Bank of Japan meeting
It's very interesting that Fed and BOJ announcements will come one day before Fall Equinox on Sept 22nd. 

Investment Actions
Staying long in stocks and ignoring news based market gyrations would be two of the most important things one can do. If the market declines, it will provide an even better buying opportunity. But it's possible that the market rallies for next 1-2 days, followed by a decline after Fed announcement, which is quickly reversed. 

In other words, there will be a lot of back and forth, and one should not get caught in such gyrations. Instead, its paramount to remain focused becaus ethat's how you can become successful in the long-term.

If interested in free e-mail list or in paid services, please fill-out the form below.

Thursday, September 15, 2016

Interesting 5 days in Stock Market

Today's sharp rally wraps up an amazing 5 day period in the markets. Today, Nasdaq 100 closed within 0.4% of all-time highs. It feels like a stealth rally, especially at a time when the entire financial media started proclaiming end of the bull market or a sharp decline, after last Friday's decline.


It has been a period through which we can learn a lot of investment lessons and become better traders. For Example:


  1. Do not panic and stay with the trend
  2. Market will continue to deliver sharp declines in a bull-market and sharp rallies in bear markets to push market participants on the sidelines or in the wrong direction
  3. Always remain aligned with the direction of the trend, no matter what the headlines are

How it started!
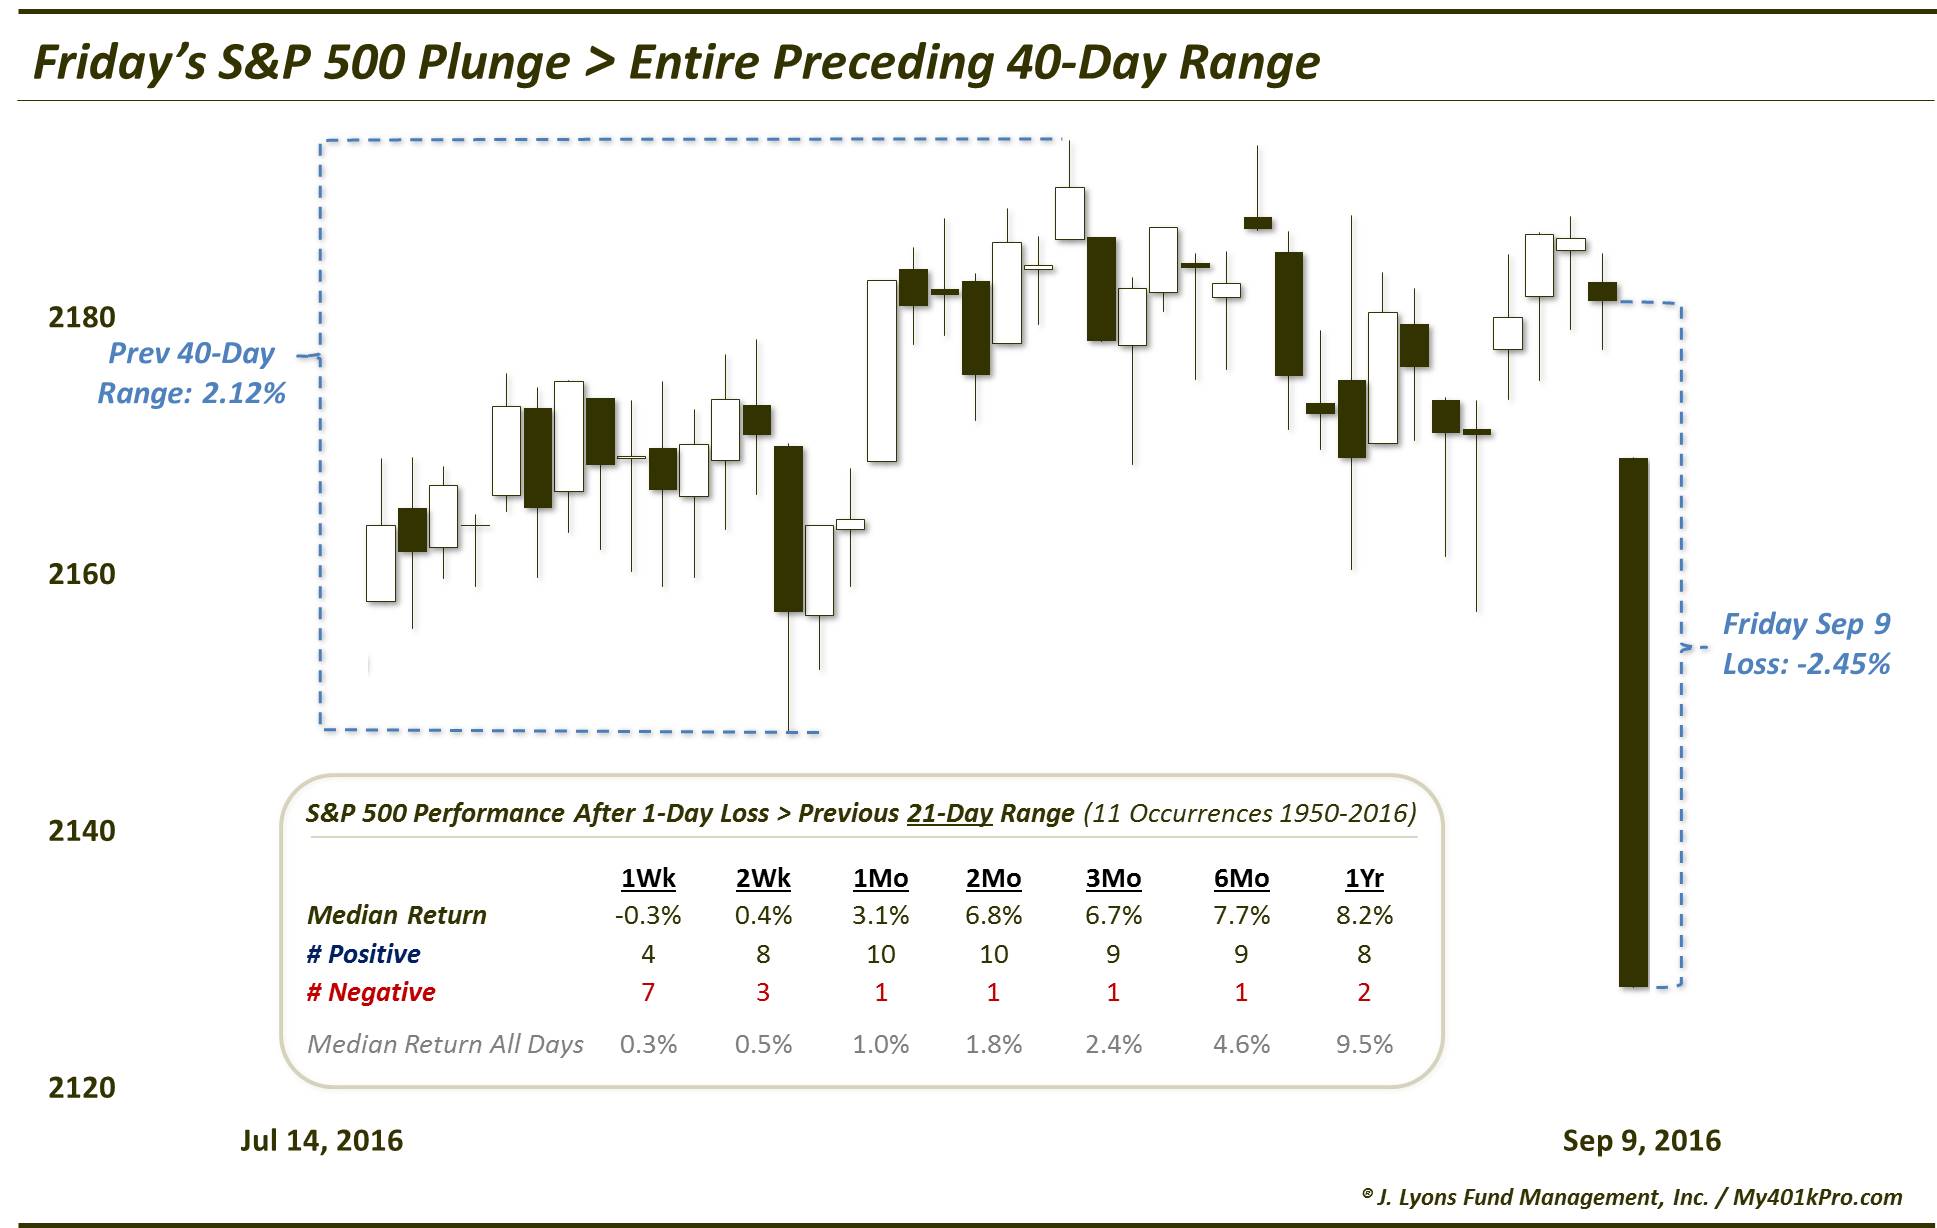
Last 5 days have been nothing short of amazing for the markets. On Friday, September 9, markets declined substantially. The decline was so significant that trading range of 40 days was covered in one trading session.


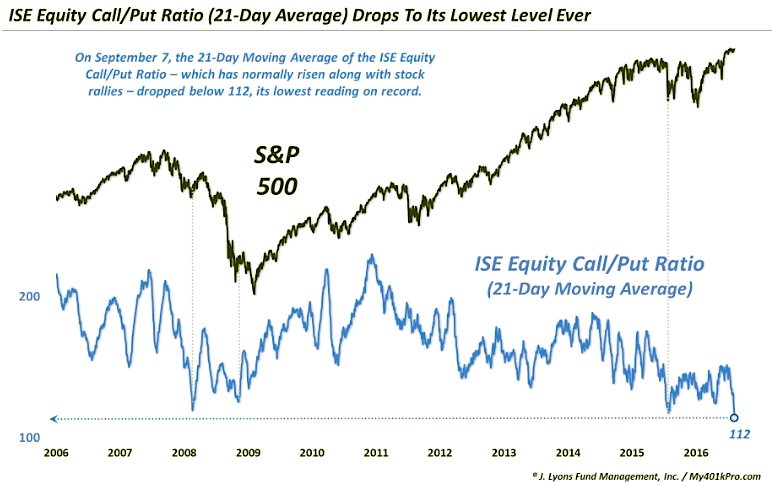
This decline was quite a departure from the dog days of Summer, where market set a record in reduced volatility. By some measures, the volatility was lowest in history. (Charts courtesy of Dana Lyons)


Although many knew that this kind of action is unsustainable, the decline that followed took many by surprise. While everyone was talking about a decline and even we were expecting a decline to shake-out the loose hands, most amusing part was the justification for this decline.


You could see reasons from Fed to emerging markets unwinding, and from valuations to sentiment based complacency. Although all of these reasons are very valid reasons, one needs to thing about these in the context of the market.

Market Trend
According to Market Classification Matrix, a proprietary indicator that uses internal strength indicators that tell us about the strength of the market, we were in a uptrend. And therefore, instead of selling or panicking, we stayed long and kept our cool. No longs were exited.

Our proprietary trading model kept it's long positions. And as September 9th progressed, we realized that this sell-off was generating several buy signals. We will discuss some of the buy signals and the reasons why we think we are just starting the next rally phase, in the next posts. Even though the decline did not result in an immediate bottom for major indices, we saw a sharp rally on Monday after morning decline, which was followed by another two declines on Tuesday and Wednesday.

But the bottom line is that many people panicked while trend remained up. There were very few people who took advantage of the market when it was declining.


Tuesday, February 2, 2016

Downtrend Continues

Market resumed its decline in a major way today. More interesting than the decline was the muted reaction from the traders, as VIX did not spike. If fear doesn't spike with declines, it means that we have further decline ahead.

Market rallied last week but got way over-bought in just few days. In fact, a sell signal was generated on Friday. That sell signal resulted in decline yesterday from which the market initially recovered. However, it was too much weight for the market to carry. As a result, it gave way to serious selling today.

We have been maintaining that the stock market's inherent structure changed last year in August, and suggested a move to cash. Proprietary portfolio allocation model allowed us to diversify between bonds and short stocks. This portfolio has been performing very well so far this year (link). It is up +6.7% this year, while SP500 is down 6.7% this year. We will talk about latest results in the next post. Right mow, let's look at the structure of the market.

Nasdaq along with many other indices, is tracing out another head and shoulders pattern. This pattern is larger in magnitude than the prior pattern, and could result in substantial decline.


Over the next few days, market will fill the right shoulder of this pattern. Once right shoulder is filled and market breaks below the neck-line, significant decline can be in the offering.

Head and Shoulders are reversal patterns, and when you see a cluster of these patterns, as shown above, they become even more important. Overall, it means that the trend of the last 7 years has ended and we have entered a bear market. This would mean that the economy will slow down and we might see additional bad news coming from different market segments. Oil was the initial catalyst but now we could see other areas hurting.

However, many people are just realizing this new development and others are still oblivious to a market decline. But we prepared for this potential scenario and now are waiting for the downtrend to unfold over the next few months. Bonds remain in a bull market, as yields continue to decline.


Friday, January 15, 2016

Bonds Bull is Roaring

We have been discussing stock market's #Bear and Bond market's #Bull for a while. Now it seems like Bond market is really taking-off. This is evident from a sharp rally in the bonds over the last 2 weeks. Some might attribute it to the declining stock market but a bull market keeps on rising and people find reasons for the rise.

As a confirmation of the trend, bond prices have just completed an inverted Head and Shoulders pattern (shown below):


We have been discussing this pattern since December, as following charts was published here on December 21.


As bonds rally and stocks decline, we are short stocks and long bonds. Being long bonds gives us cash flow in form of dividends and being short stocks allows us to take advantage of the downside.

Like any market, this bond rally will come across obstacles but the constant cash flow and the diversification provided by this investment is invaluable, along with the potential for capital gains. At the same time, it will provide a very good opportunity and probably the last opportunity for people to buy homes at very low interest rates.

As market gets more volatile, it will even make more sense to invest in bonds. But the good time to invest in any asset class or stock is before the major move happens and the news becomes public. Let's see when the stock market bounce happens, which might provide added insight into the long-term (6 months to 1 year) market trajectory.

After all is said and done, there will be a very good opportunity to buy stocks down the road.


Monday, December 21, 2015

Bonds Rally Analysis and Stocks

Market's decline on Friday was very sharp and was on top of Thursday 250+ point decline in $DJIA. This decline has brought the market to a critical support level in Nasdaq and $DJIA, while in other indices like Russell 2000 and $SPY this critical level has already been broken to the downside.

Downside break means that the near term trend has turned down. Although some technical analysts might take this decline as a trend change signal, at UST we have been suggesting that a sea change has already taken place in the stock markets in August.

Unfortunately, many market participants are still not seeing the bigger picture because they don't follow objective trend analysis. Instead, they follow the market events and try to gauge the markets response to these events. At Understand, Survive and Thrive, we have always used objective market analysis and statistical models to identify market trends and turn points.

In the last post (link), we analyze the significance of recent Federal Reserves action and suggested that although the Federal Reserves thinks that the economy is strong and they can raise rates, this rate increase could not only have negative consequences on the market but also could result in lower rates. Longer term rates are governed by the perception of the economy of market participants and if investors don't believe in the same story of strong fundamentals, they might keep on buying the bonds, resulting in lower bond yields and higher prices.

Although this concept does not make intuitive sense, it was evident in the last few days where the market went down and interest rates also went down even after Fed's rate hike.

We have already discussed the potential fundamental issues with the economy and how its depends on the perception. There are also several technical reasons behind rally in bond prices:
  1. Inverted Head and Shoulders Pattern
  2. Capital outflow from bond funds
  3. Proprietary trend indicator
Current pattern in the bonds suggests that the longer term bonds, as depicted by $TLT below, are carving out an inverted head and shoulders pattern. As you know, inverted head and shoulders pattern is a bullish pattern and shows trend reversal from lower to higher. So it will be interesting to see how the market reacts over the next few weeks when this pattern matures and is about to break-out.


From socio-economic and sentiment perspectives, in anticipation of Fed's announcement many people jumped ship from the bonds and exited in great numbers. This could be interpreted as a potential contrarian buy signal for longer-term bonds.

Finally, as we have been saying for quite some time, bonds are in bull market for some time and will remain till model says otherwise. Therefore, we will find reasons for the bull market to continue which can be either due to economic weakness, technical rally or delay from Fed in raising rates further.

Please note that this analysis is only pertaining to high quality long-term bonds and not related to Junk bonds, which are linked to the economic activity. Weakness in economy would result in a decline in Junk bonds, as we have been witnessing over the past few months.

Friday, December 18, 2015

Fed Decision and its Impacts

After 6 years, Federal Reserves raised the Fed benchmark rate. While on one hand it signifies the fact that the underlying economy is doing well because of which Fed increased the rates, it also suggests that the market should embrace the new normal i.e. upcoming higher interest rates. Higher rates can impact many different walks of life ranging from savers to home owners.

Higher rates mean lower bond prices and could impact:
  1. Home buyers
  2. Credit Borrowers
  3. Real estate investors
  4. Savers
  5. Equity investors
  6. Bond investors
Although one can write separate blog posts for every individual class, the major theme will revolve around increased cost of credit. With increased borrowing cost, it will get difficult to buy homes, borrow for credit card purchases, borrow for investments in real estate or other venture, thus reducing the flow of money in the economy.

It will also encourage corporations and individuals to save and at some point make equities less appealing, as they will be able to get higher rates without added risk. Please don't get me wrong - savings are the engine of long-term economic development, while spending helps in the short-term.

Since the rates and prices move in opposite direction, rate increase by Feds means that bond prices will decline. However, contrary to this simplistic idea, UST's proprietary bond market analysis suggests that longer term bonds are still in a bull market. It is one of the 3 primary asset classes that is in a bull market.

Therefore, bond investors should not be scared by this Fed hike. Bonds will continue to do better for some time. This also flows well with our discussion on objective trend following, in the last blog post. Objective investing requires one to analyze asset classes holistically rather than event based analysis. And at this point, holistic picture based on proprietary indicators is suggesting that the bond market will do better. This could mean:
  1. Stocks are going to perform poorly to push interest rates down even with fed hikes
  2. Fed fund rate hikes will be in contrast to economic reality, and could result in yield curve inversion
Both of the above scenarios are bad for economy and investors. In the next few posts, we will discuss:

  • Detailed discussion on potential causes of bond yield decline even with Fed's increased rates
  • Alternative investments, according to their state - Part 2
  • Elliott Wave analysis of current stock market
  • Asset allocation options
  • Tax implications 
  • Revisiting Objectivity and market trend

  • Let me know if you think the best time to buy homes is about to come or has already passed?


    Monday, August 24, 2015

    Stock Market - Black Monday (Aug 21, 2015)

    Today's market action was very scary. Since last week to today's lows, markets decline over 10%. This decline wiped out more than ~$1.5 Trillion in wealth from the stock market.

    If you had looked at the news today, it was horrific. There was live coverage on the decline even on channels like CNN. I have received several calls from investors trying to figure out if they should enter the market or not. And how are the proprietary models of Understand, Survive and Thrive, reading into this market.

    I would like to start by saying that panicking will not help!!!

    DJIA completed a head and shoulders pattern at the top, which was not noted in the financial media. This kind of development suggested that we should expect this head and shoulders pattern to play out. However, I did not expect a crash like scenario.

    Now that we have seen the flash crash type of event, the big question is how should one proceed. Should we buy the dip or use the rally to sell-out of equities. In order to objectively analyze these two options, lets look at three Bull/Bear market indicators that we have used to great success.

    1. Yield curve inversion: Historically, over the last 50 years no bear market has ensued without yield curve inversion (link). If that is the case, yield curve is not inverted yet and therefore, we should give benefit of doubt to the market
    2. Proprietary Bull/Bear indicator, using optimum Bull/Bear criteria, is calculated on a monthly basis. As of last calculation at the end of July, it was registering 70%, which is above the threshold of 65%. Although the indicator will be recalculated on Aug 31, persistent market decline can result in us entering a bear market. This would mean that we have several months of lower prices ahead. The true result will come out on September 1st and therefore, no decision of exiting longs will be made till that time
    3.  Another very important Bull market indicator is still bullish which uses Global Dow as the proxy of global stock markets. It would need September data to declare whether we have entered a bear market or not.
    Therefore, next few days will be very crucial for the market. Since the yield curve has not inverted yet, the chances of entering a prolonged bear market are very slim. As a result, this should be a buying opportunity. If the market is to avoid entering a bear market based on proprietary indicators, it should rally hard over the next few days. From a geo-political standpoint, it would make sense for the market to stay up for till next year's election because there is no change in policy and Congress gridlock continues.

    In conclusion, we should expect a sharp rally over the next few days. Otherwise, markets will enter a prolonged bear market, which yield curves inverting over the next few months.


    Friday, May 8, 2015

    Portfolio Positions - Dollar Tree

    Sideways action continued this week also. This sideways action can be very demoralizing for regular market watchers, as no one really knows what will happen next. But there is a famous phrase on the street, which says that "one should not short a dull market." Although this market is not dull on a day-to-day basis, it has been pretty dull over the last few months.

    Good investors make money in these type of markets by selling stocks that have already rallied during this phase and re-distributing proceeds into positions which have not performed so well. In this way, they are better positioned to take advantage of potential rally.

    A very good example in this regard is Amazon. Amazon declined throughout 2014 after topping around 400 in late 2013. While Amazon was declining, it was a good opportunity to accumulate. Since Amazon was in a bull market based on proprietary model, adding to long positions paid off big time in 2015 with Amazon rallying from 300 to 430 in just 4 months. Therefore, the gains would have been amplified, as one would have bought multiple shares at lower price.

    The goal of the new model is to buy good businesses that actually sell tangible products or services. This would mean that investors are actually investing in good companies.

    The most recent example in model portfolio is Dollar Tree stock. Dollar Tree rallied in the first two months of this year, but since then it has been declining. As a result, proprietary allocation model increased the exposure in Dollar Tree in May because it is in a bull market. Model will keep on changing the ratio based on analytic modeling, as long as the stock remains in a bull market.


    If the stock is truly in a Bull market, it will rally sooner or later and thus, gains will be amplified. If not in bull market, portfolio will exit the stock position on proprietary triggers. We will see...


    Saturday, April 25, 2015

    Lessons from Nasdaq and Beating the Market

    Last week was a positive week for the overall market. Blue chips gained some but Nasdaq gained a lot. Nasdaq is now within few points of all time high, which was set in 2000.

    Although Nasdaq (the darling of 90s) is now approaching all-time highs after 15 years, many of the companies that were making higher highs in early 2000 are no where to be found in today's market. If one had invested in selected few companies, he would still be at a much lower level.

    The story of Nasdaq taking 15 years to reach its all-time highs, teaches us two important lessons:
    1. Market can remain below a certain level for eons. Therefore, buy and hold might not be the best strategy
    2. Individual stocks are extremely hard to manage because of their individual unique profiles, company cultures and other aspects
    Being said that, now the question arises how can one then beat the market and should one hire a money managers, with ton of market experience, to beat the market. Lets tackle both of these questions one by one:

    Firstly, over the long-term (~20 years) only 1-2% of the money managers beat the market. This means that the probability of selecting a winning manager is .02. In other words, if you have the choice of investing money with 100 money managers, only 2 will be able to beat the market over the long-run. Furthermore, all of them will take money management fees. So should one invest with money managers with such low odds of success?

    This observation gives credence to Warren Buffet's concept that its better to invest in low cost ETFs that follow the market and at least perform better than majority of the money managers because you will be closely following market's performance. But this method does not answer the question of how to beat the market. Although it is a difficult question to answer, it is a very good question to ask!!

    In order to beat the markets, one should buy good companies and ride them as long as they perform well. If they enter a bear market, one should start riding another well-performing company. Although this concept seems very simple, it is very difficult to implement. In order to effectively implement this concept one needs following 5 pieces of information:
    1. Which companies to invest in?
    2. Whether selected stock is in a bull or bear market?
    3. How much to invest in each position? 
    4. When to exit a certain position?
    5. How to protect gains? 
    As you know Understand, Survive and Thrive has been performing market analysis over the past several years with the goal to optimize portfolio returns using objective techniques and algorithms to take out emotions from trading. We have recently tried to incorporate above mentioned 5 pieces into our model for long-term investing.


    Wednesday, February 19, 2014

    IPM Trade Matrix Update - Trade 5 (Part 5)

    Trade Overview
    Today's market action was very constructive. While on one hand large caps like DJIA and SP500 absorbed recent gains by going sideways, small caps and tech stocks rallied sharply. This rally in small caps is a very encouraging sign for the broader market rally. Furthermore, breadth during this rally has been very impressive. 

    Following chart shows a smoothed Advance/Decline line. According to this chart, market breadth hasn't been this strong in a while. 

    Please note that this chart has two implications:
    1. We won't enter a new bear market right away i.e. current rally has a ways to go: 1929 comparison should not be taken seriously
    2. We might be approaching an overbought area and could see a pull-back over the next couple of weeks.
    This chart also confirms IPM Trade Matrix's buy signal. The only difference is that the IPM Trade Matrix generated its signal several days before the breadth jump. Therefore, IPM Trade Matrix is a real-time actionable system with greater profit possibilities. 

    Our Elliott Wave structural analysis of the market suggests that the market is in a firm uptrend. We are at least a week away from an intermediate term correction. Please note that this will not be a serious correction. It might just fill-out the right shoulder of the Inverted Head and Shoulder pattern (discussed earlier). IPM Top date has already been e-mailed to subscribers.


    As evident from the above chart, market has just completed a sequence of 1s and 2s. As long as the stop levels are not broken (outlined below) we will stay long. If profit objectives for TNA are hit, we will bring our trailing stops closer per IPM Trade Matrix definitions and will let the market decide its next move.

    Elliott Wave analysis cannot be completed without sentiment analysis. And current sentiment analysis suggests that we are still not seeing optimism in the market. This is  very good for the health of this rally. We will keep an eye on the stop levels and profit objectives, as we are approaching the end of Trade 5 per IPM Trade Matrix.


    IPM Trade Matrix 2014 Trades

    TRADE - 1: (Long) = +2.6%
    TRADE - 2: (Short) = +9.3%
    TRADE - 3: (Long) - Non IPM Trade Matrix trade -0.2%
    TRADE - 4: (Short - 1/31/14 to 2/5/14) +7.25% 

    TRADE - 5: Long
    Long TNA at 70 ==> new TNA basis = 69.94 (added few longs today) 
    Longs were initiated on 2/11/14 and 2/13/14 based on IPM Trade Matrix Trigger and Elliott Wave structure. More might be added if opportunity comes within IPM turn window. 

    TRADE CONDITIONS
    Condition: Bottom within IPM Turn Window  
    Trigger: Rally above SP500 = 1789, DJIA = 15790, Russell 2000 = 111.5, Global Dow = 2401
    Supporting Indicators: Up trend (8/4 did not complete), Next IPM can be either Top/Bottom

    PROFIT TARGETS
    Profit Target 1: 1870
    Profit Target 2: 1930

    RISK
    Stop: Break below 1750 (valid till we are within IPM Turn Window)
    Trailing Stops: Break below 1790 (SP500) and 15780 (DJIA)
    Typical IPM Trade Matrix Risk: 1.5%
    Actual IPM Trade Matrix Risk: 1.3% (Entry = 1813, Exit = 1790, Risk = 1.3% )
    Risk Reason: There are multiple reasons to be worried: 1929 stock market parallel, 8/4 Test to the downside is in process (will be invalid at new highs) - almost invalid, and major IPM Bottom window in process - almost invalid.  

    Applicable Rule (There are 7 Rules in the IPM Trade Matrix. Following are applicable to the market right now): 
    1. Do not go long or short without trigger to prevent losses by market moving against you.  
    2. Exit half at profit objective 1. Exit full at profit objective 1 if proprietary momentum continuation signals are not present.
    3. Observe stop-losses to minimize draw-downs

    Note: IPM Trade Matrix Trades will be posted in the first half of 2014. This is an experiment to understand and enhance the capabilities of this Matrix.


    For Blog updates on Google+ add: Understand Survive Thrive 
    For Blog updates on Twitter, add: @survive_thrive
    For E-mail updates: 

    Sunday, February 16, 2014

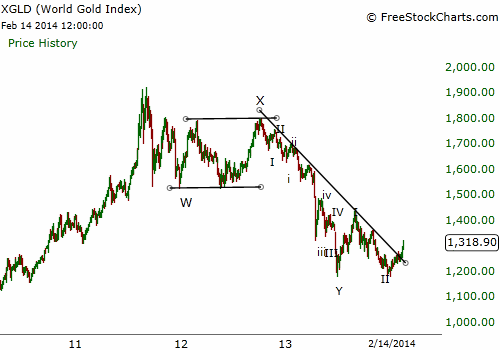
    IPM Model Update & Gold Breakout

    IPM Model Update Has Been E-mailed to Subscribers.

    IPM Trade Matrix Updates: IPM Trade Matrix Update - Trade 5 (Part 4)

    Gold & Silver are breaking out. There are several reasons to be optimistic about their prospects:
    1. 8/4 Test has been completed to the Upside in both Gold and Silver on both dail and weekly time frames. This suggests that the trend has reversed, and we should start looking for upside surprises. 
    2. Long-term trend lines have been broken to the upside.
    3. Sentiment had reached pessimistic extreme few weeks ago, which was in line with a generation precious metal bottom
    4. Bottoming process took its due course which is encouraging for the market
    5. Miners have really started out-performing the metal. This is another exciting and encouraging sign.
    6. Rally from the bottom has been impressive, and suggests a new trend has started.


    Confirmation of a new Bull market will be a rally above 1460 in Gold.


    For Blog updates on Google+ add: Understand Survive Thrive 
    For Blog updates on Twitter, add: @survive_thrive
    For E-mail updates: