Twitter

Showing posts with label Fed Minutes. Show all posts

Tuesday, April 4, 2017

Gold Rally Can Pause!

We started investing in Gold in 2016 April, after 4 years of being out of the Gold market. We again increased Gold exposure at the start of 2017, in our proprietary strategies (Jan / Feb
2017 Investment Strategies' Performance). Overall, Gold remains in an uptrend but recent development has made us wary of immediate upside of Gold. 

In this post, we have analyzed Gold's short-term prospects using multiple analysis techniques to showcase the rationale behind our caution:

Technical
After experiences a sharp decline in early March, Gold has rebounded nicely. It is now testing significant trend-lines (show below). These trend lines could act as resistance in the near-term and force Gold to consolidate.


Sentiment
While Gold could experience a pause, it will be a very constructive development. But what is not constructive is the fact that news media has recently turned bullish on the yellow metal. Following are some of the recent bullish Gold headlines:


Furthermore, other sentiment indicators also suggest that Gold and Silver are in for some turbulence. Following chart shows Silver positioning among large and small traders. Current positioning is at levels that have resulted in Silver going down or sideways.
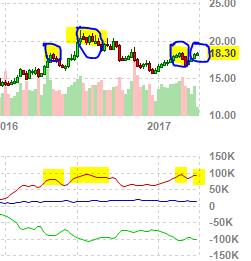
One cannot believe the financial news media because they get behind a trend, once everyone is on board. A detailed analysis of 2016 news and market action is presented here. Therefore, investors need to remain objective in terms of their direction and action plan.
Short-term structure:

With sentiment picture on the optimistic side, its likely that the trend will experience some pause before really asserting itself in the next few days. Above chart shows a potential inverted head and shoulders pattern being formed in Gold. However, the right shoulders doesn't look complete. Some back and forth action will be ideal to complete this structure.  

Gold Influence
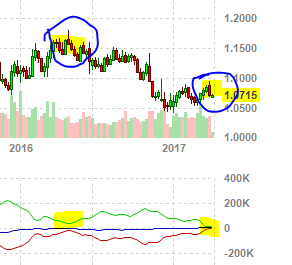
Gold is significantly influenced by USD and Euro. Strong dollar pressures the commodities complex. It looks like Dollar has completed a long-term correction since the start of 2017, and could rally for few weeks. Start of 2017 is the same time when Gold start rallying. Once US Dollar rallies, it would be negative for Gold and Silver markets.
Furthermore, Euro long positions are also very extreme, which means that Euro will soon experience correction. Euro decline will also fuel Dollar rise; another reason that could dampen Gold’s ascent.
Conclusion
Gold could experience some resistance around these levels because of technical, sentiment and influence from other areas. However, that doesn’t mean that Gold will not spring back or it has entered a down trend. In financial analysis, one needs to remain objective.

How are we positioning?
We have reduced our long exposure but maintain long positions because Gold remains in an uptrend, as per proprietary Market Classification Model. Details will be shared with subscribers by April 9th. Our conservative proprietary strategy has out-performed the market in 2016 and in Q1-2017 through objective risk-management and a combination of strategic & tactical allocation. Detailed performance analysis will be shared in next 2 weeks.

Want to Invest
You can invest in these strategies through “Managed Account” offering or by subscribing to some of the services like Market classification Model (subscription page). MCM serves as the backbone for our model and can help you develop an understanding of the markets.  If interested in investing, you can register below and we will send an update. 
 

Monday, October 17, 2016

Market Timing (IPM Model) & Structure

Just re-ran the Inflection Point Model and it seems like the next turn window is approaching fast. It is scheduled for October 21, 2016 (shown in chart below)
As you can see from the above chart, last turn window was on Sept 26, 2016. And the market topped on Sept 22, 2016, followed by ~3 weeks of sideways action. Following chart shows the best market structure representation with latest timing information


Market is still in a sideways correction. In fact, the 2nd portion of this correction took the shape of a triangle (X). Now it is in the final leg of this decline. So far, this last leg of the decline has been tracing out 3 waves, which means that this might turn into an ending diagonal.

Last wave will be sub-divided into 5 parts. 2 of 5 have been completed. The market could bottom in the area of 2090-2065 (SP500).

A signal of bottom will be generated by a buy signal generated within the IPM turn window. Confirmation will be received by a rally above critical proprietary levels.

Overall market trend remains up and this correction should give way to a sharper rally. Seems like market is setting-up for a wash-out to scare enough people out of the market, so that a big year end rally can start.

If your already long, stay long. If you want to go long, wait for another few days and then start adding longs.

Market Classification Model
Market Classification Model (MCM) remains bullish on the US stock market. It turned bullish in July 2016 and has remained bullish through last 3 months. Even though many market pundits have been advocating a sharp decline.

Persistent investment behavior is critical for longer-term capital gains because that's the best way of gaining preferred tax treatment, which can significantly help your portfolio.

If interested in free e-mail list or in paid services, please fill-out the form below.

Sunday, August 21, 2016

Stock Market Structure

Stock Market and Bond market action suggests that both markets are consolidating. Once this consolidation is complete in the stock market, we should see a rally. 

We discussed about the potential of sideways market action and formation of a head and shoulders pattern on Aug 8th. As of Aug 21, market has traced out the right shoulder. 


Aug 8, 2016


Aug 21, 2016
Now that the right shoulder is almost complete, next step is to analyze the market structure to identify next steps. 

From an Elliott Wave perspective, market is currently in the last wave of the up-move. When we say last wave, it by no means mean that this will end the bull market. Instead, it just means that the current rally phase will give way to relatively large decline.


Recent market consolidation has helped in reducing market participants' optimism over the past few weeks, as evident from recent surveys. This will help in the next short-term rally phase. However, since the market is nearing the end of the larger rally phase which started with Brexit vote, we will see a resurgence of optimism and sharper decline.

In the above chart, a box is placed to show potential price and time range of market top based on Fibonacci relationship and IPM market timing analysis.

Overall market trend remains up. Even if the market declines, it will lead to higher prices till the time Market Classification Model is in Bull territory for the stock market.


MARKET CLASSIFICATION MODEL
A proprietary algorithm that classifies market conditions i.e. Bull market or Bear market. Currently, this model is suggesting a longer-term up-trend for the US Stock Market. In fact, this model is close to triggering another new Bull trigger.

Friday, August 19, 2016

Bond Market Update and Impact on Stocks -

A very quite week from all perspectives. Even with the Federal Reserves meeting minutes, the overall temp of the week remained slow. All of the major asset classes went sideways. SP500 was up +0.2%, while Bonds were down -0.5%. This kind of market action suggests that last week was very non-eventful and something big is coming-up in the near future.

We have already talked about the next stock market turn window - scheduled for around August 30th. Analysis suggests that the next turn would most likely be a near term top.


Therefore, with a turn window approaching and Jackson Hole summit scheduled for next week, there is a very good potential of market rallying next week.


Bond Market Bear Scenario


Typically if stocks rally, bonds decline. At the same time, bonds have other reasons for a decline. From a technical perspective, bond market is tracing out a bearish pattern. Following chart shows bonds consolidating in a triangular form, after July's sharp decline. Typically, this kind of consolidation is followed by a break in the prior direction.


Another reason to consider this scenario is that blue average can act as magnet on this decline. This decline will have deeper consequences for the entire market for the month of September. We will discuss these consequences in the next post.


Bond Market Bull Scenario


Just to provide a perspective on market action, good investors should also consider all the scenarios. From a bull perspective, market seems to be undergoing a sideways correction in a triangle form. This consolidation will result in an immediate break to the upside.


The problem with this scenario is that, this would mean stocks would go down. However, it seems unlikely because the Jackson Hole meeting and IPM turn window suggest a stock market rally.


Conclusion


A bond market decline and stock market rally makes the most sense. But please keep in mind that Bonds and stocks both are in bull markets, according to our proprietary Market Classification Model. MCM has kept us on the right side of the trade and has resulted in some amazing YTD results in 2016.


Subscription to MCM is open for investors (Services). 

Thursday, August 18, 2016

Inflection Point Model - August Turn Date

Market's decline over the past few days probably culminated at today's Fed meetings minutes. Although there was nothing significant in the minutes, underlying uptrend of the stock market is taking the lead. 

There are several ways, technical and non-technical, in which one can justify either direction of the market i.e. up or down. But in any case, according to our proprietary market timing model, the next turn window is scheduled for Aug 30, 2016 (+/- 4 days).


Although the turn date signifies a major market inflection point with the direction, different market indicators suggest that current rally will continue till the end of August. End of August turn window will most likely be a short-term market top. 

This also means that next week's Federal Reserves Jackson Hole meeting would also propel the stock market. We will will discuss other indicators in the next posts. But the key thing to keep in mind is that no matter what anybody says about the market, the path of least resistance is always with the trend.

Currently, according to proprietary Market Classification Model, the stock market is in an uptrend. This model took us out of the stock market in September 2015 and kept us out of the stocks till June 2016. As a result, we avoided the sharp market gyrations, while investing in better performing areas.