Twitter

Showing posts with label forecast. Show all posts

Thursday, March 16, 2017

Next IPM Model Turn Window

After briefly topping at the last turn date of Feb 28, 2017 (link), market rallied yesterday on Federal Reserve's announcement. 

Market Condition

  • During the correction since Feb 28, market did not generate any sell signals. In fact, it generated several buy readings from oversold perspective. 
  • At the same time, Sentiment as subsided in the past few weeks, which will provide fuel for this rally to continue. 
  • From a government perspective, they are busy with controversies and will not be able to influence the market. 
  • Furthermore, Dutch election results were positive for the overall geo-political situation

Hence there are no significant headwinds in front of the stocks right now.

We remain long the stock market because Market Classification Model remains bullish, which turned bullish on stocks in July 2016 and has remained bullish ever since (2017 Investment Performance). However, it is critical to understand potential future turn dates.

According to latest Inflection Point Model re-run, stocks will likely experience turbulence in the first week of April. Following chart shows the IPM model output.
IPM Model turn date is scheduled for April 5 (+/- 4 days). Most likely, this will turn out to be another intermediate top, which will last till majority of companies start reporting their earnings in mid April. However, it will be sufficient enough to make bears out of many longs. 

We will continue to evaluate the market conditions for any sell signals, as we approach this turn date. In the mean time, it seems like this rally could continue for another ~2 weeks.

If your interested in free e-mail list or in paid services like Market Classification Model, please fill-out the form below.

Monday, October 17, 2016

Market Timing (IPM Model) & Structure

Just re-ran the Inflection Point Model and it seems like the next turn window is approaching fast. It is scheduled for October 21, 2016 (shown in chart below)
As you can see from the above chart, last turn window was on Sept 26, 2016. And the market topped on Sept 22, 2016, followed by ~3 weeks of sideways action. Following chart shows the best market structure representation with latest timing information


Market is still in a sideways correction. In fact, the 2nd portion of this correction took the shape of a triangle (X). Now it is in the final leg of this decline. So far, this last leg of the decline has been tracing out 3 waves, which means that this might turn into an ending diagonal.

Last wave will be sub-divided into 5 parts. 2 of 5 have been completed. The market could bottom in the area of 2090-2065 (SP500).

A signal of bottom will be generated by a buy signal generated within the IPM turn window. Confirmation will be received by a rally above critical proprietary levels.

Overall market trend remains up and this correction should give way to a sharper rally. Seems like market is setting-up for a wash-out to scare enough people out of the market, so that a big year end rally can start.

If your already long, stay long. If you want to go long, wait for another few days and then start adding longs.

Market Classification Model
Market Classification Model (MCM) remains bullish on the US stock market. It turned bullish in July 2016 and has remained bullish through last 3 months. Even though many market pundits have been advocating a sharp decline.

Persistent investment behavior is critical for longer-term capital gains because that's the best way of gaining preferred tax treatment, which can significantly help your portfolio.

If interested in free e-mail list or in paid services, please fill-out the form below.

Thursday, September 22, 2016

Federal Reserves and Market Action

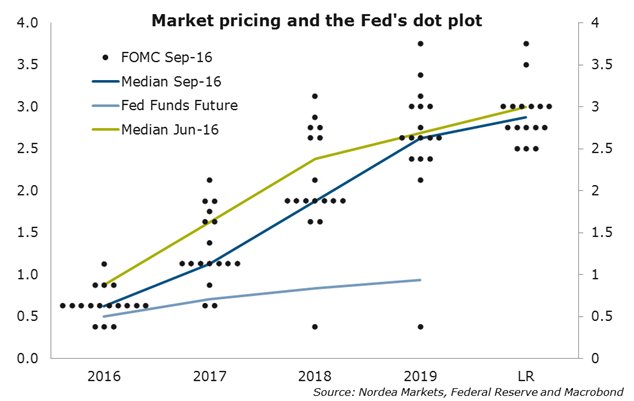
The Fed announced holding the rates and provided guidance for potential increases in future. It wasn't anything out of the ordinary. It was highly unlikely for the fed to raise rates at such time before the elections. However, the more interesting reading came from the dot-plot.

Fed uses this plot to provide guidance regarding future interest rate path. Median of the dots show a curve where Fed officials believe interest rates should be over the next few years.

Following chart shows the plot:


Along with the dot plot, above chart also shows the median projections for the next few years as taken in June and September. As one can see these estimates have come down a lot. As a result, the expectation of interest rise have also decline.

Once this expectation declines, it gives was to higher bond prices and lower yield. At this time, higher bond prices would mean more liquidity, thus being favorable for the overall asset class complex. This situation will surely change one day. For now, we are in an uptrend. In yesterday's analysis on Pre Fed and Bank of Japan announcement, we shared same outcomes

Market Classification Model has been bullish on Bonds for years now. And it seems like there is no reason to bail-out on bonds just yet. Even though many financial gurus have been predicting an inevitable bond demise, which will happen one day, current situation is supportive for a bond rally. As long as trend remains up, forecasts for bond collapse will not come to fruition. Therefore, it's imperative that one remains with the trend.

At Understand, Survive and Thrive, we use Market Classification Model to stay aligned with the trend. MCM is an algorithm based on some of the most time-tested market indicators and their inter-relations to determine when the trend changes, so that we don't stay on the wrong side of the trend for long.

If interested in free e-mail list or in paid services, please fill-out the form below.