SP500 Closing Level - 1160
| Market: Bear | Defining Level: 1210 |
| Trend: Down | Defining Level: 1242 |
| 4/8 Trend Change Confirmation (Up to Down): Yes | |
| Current Trade: Short from 1186 (Shorted market on break below 1187) Profit Objective 1: 1150 (achieved - half @ 1143 Trailing Stop (closing): 1173 Profit Objective 2: 1114 (stops will be lowered) EW Stop: 1173 Status: This short trade can be a 1-2 week swing trade. We are now at break even in terms of stops. | |
| Next Trade / Model Based Approach: N/A Stop: Risk: Risk Associated with trade: N/A | |
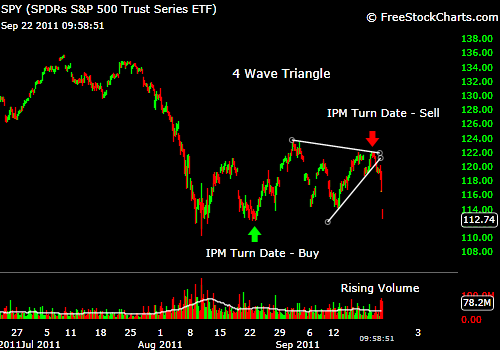
| Turn Window: September 28 (+/- 4 days) Market is in the turn window. Market might have put in a double top. | Scenarios 1- Market bottoms in turn window 2- Market tops in turn window 3- Market double bottoms and breaks out 4- Market double tops and breaks down |
| Observations: Last Trading Algorithm update suggested that the market might have turned during the Inflection Point Model's turn window, as the market structure had completed. This shows the importance of analyzing the market structure in conjunction with the turn date. Proprietary indicators have been indicating for the past several weeks that we are in a well defined bear market. In a bear market, one should expect surprises to the down side. Following figure shows that over the past several days, market has been stair stepping down with a series of lower highs and lower lows. This kind of market behavior is a classic downtrend example.  Alongside being a persistent decline, the decline has been very orderly. This kind of behavior suggests that the market is not yet ready to put in a bottom because bottoms are formed with a spike in pessimism. Hence, we can see the market declining for several days. Furthermore, above chart shows a series of overlapping waves. Some (including me) might argue that this behavior is represents a corrective pattern and that we will soon rally from here. But interestingly, all of the wave-1 declines have been 5-wave affairs. In other words, the market is tracing out a series of 1s and 2s, and once the market enters the 3rd wave down it will be a sharp decline (might be a mini-crash). Therefore, one should not be long in a down trending market with a possible series of 1s and 2s. In fact, since there is a very high potential of new lows, one can short the market with tight stops. Finally, if this pattern plays out we will be able to dramatically reduce the risk from this trade, once the next down phase starts. As far as the Trading Algorithm is concerned, it has been short for few days now. Unlike recent shorts, current trade might last for another week, so one needs to be patient in order to reap gigantic profits. We will keep reducing the stop locations along with the market, thus, eliminating risk from our trade. In order to manage risk in the current trade, stop has been reduced to 1175, and will be further reduced after another lower leg. We will update this sheet with market updates and potential dates to cover the short-positions as time goes on. | |
UST subscription details and invitations have mailed to registered e-mail addresses. Subscription will close in mid October, and will re-open in January 2012 (at the earliest). Several readers have already registered. Starting next week, public will receive delayed Trading Algorithm updates. So if you are interested in identifying the next market turn and/or to manage risk in your trades, register soon and Subscription Information will be sent to you via e-mail. Since subscription is highly exclusive, membership form and other material will only be sent via e-mail.
Reserve your Subscription Spot - Before mid October Deadline