- Brexit induced anxiety
- Election related stress
- Post-election disbelief
- Post Executive orders convolution
Thursday, February 23, 2017
Market Behavior and Impact on Gold
Saturday, February 4, 2017
January 2017 - Performance Review
Following chart shows how SP500 performed in the first month of 2017:
To summarize January action, it was a volatile month. Volatility does not only impact our portfolio, it hampers our investment decisions, self-confidence and risk-taking abilities. In order to reduce the impact of volatility and realize long-term consistent results, UST team develop proprietary strategies based on our 8+ years of investing experience, as documented in this blog and other sources.
These strategies went live with real money at the start of 2016. Their 2016 performance has been documented here (link). Our team is currently working on more than 5 strategies. Two of these strategies have moved to production, two are in beta phase and others are in final development phases.
Investment Strategies
Two strategies (one conservative and other aggressive) will be used for clients' investment needs. These strategies are customized to meet the performance and risk profile needs of investors. These strategies utilized strategic and tactical portfolio allocation techniques, along with proprietary market timing methods to generate Alpha with extremely low correlation with the benchmark SP500. Hence, have very high Sharpe Ratios.
Following chart shows January 2017 performance of Conservative and Aggressive strategies, directly taken from the brokerage account.
Interested ?
There are two ways to follow and invest in the strategy:
- Utilize some of the offerings that UST offers (link). We will officially start sending our Market Classification Model updates in February 2017. And plan to add additional services in the next few months.
Monday, January 30, 2017
Amazing 2016 for UST Proprietary Strategy!!
Introduction
We will start 2017 by reviewing 2016 performance. This review will cover every aspect of the performance, along with how the strategy performed in times of uncertainty and volatility. Each blog post will cover a different aspect of the performance review.
UST team has been developing repeatable, scalable and easily explainable proprietary investment strategies, along with built-in risk-management measures. In 2015, the strategy was developed and back tested. Last year, strategy was moved to production with real money. At the same time, we also developed 3 additional strategies, which will be discussed in future posts.
2016 - The Year of Volatility:
2016 was a very volatile year. It started with one of the worst starts of the year for the US stocks. Although market started a rally phase from Feb/March time frame, it remained on the edge due to following three major reasons:
- US presidential election primaries
- Fed's rate decision
- Brexit
Interesting aspect of this strategy is that the returns are uncorrelated with the market. 2016 Beta was -0.57, while 9 year back-testing showed a Beta of -0.08. Since the returns are totally independent of the market performance, we can say that these returns were Alpha.
We are working very hard to make these strategies available for investors. If you are interested in investing, you can register below and we will send you update when the strategy is available for investments. Some of the key outputs from the data models used in this strategy are also available through subscription
Tuesday, December 6, 2016
November Review and December Forecast
- Bond Market Analysis
- Gold Analysis (Part 1 - Structure, Part 2 - Sentiment)
Thursday, November 10, 2016
Post Election Investment World
Such a market action in the face of presidential uncertainty is amazing. Although it bodes very well for the overall economy, we will talk about potential Trump impact in the upcoming post.
From an investment perspective there are different scenarios that one needs to be aware of.
Stock Market:
As stocks break out into uncharted territory and Nasdaq approaches the vacuum zone, it means that we are on the cusp of a major rally.
Like many rallies before it, this rally will also be debated by market participants as to why would market rally while president's economic plan would mean job losses. However, the pattern suggests that the stock market remains in a bull trend.
In essence, the underlying economy is very strong and would result in strong growth without any external influence. We will discuss internal structure of the market in future posts.
Bond Market:
Bond market's sharp sell-off probably suggests that the long-term bond bull market has ended. We are probably on the cusp of a significant inflation cycle. Near zero bonds are a thing of the past. Even though we might see some respite from the Federal Reserves, which might hold-off on the decision to increase the interest rates, we are surely in for higher rates.
Following chart shows a very long-term bond yields. Post-election rally has broken a long-term down trend line - another confirmation of the trend change. We have been keeping track of this wave count for years now and have discussed potential bond yield bottom with clients.
Many of our clients bought houses, properties etc in the last 2 years!
This market behavior has significant consequences for investors and we will discuss these consequences in detail. However, one should keep in mind that this kind of behavior will not result in bonds going to stratosphere in the near future. In fact, after couple more months of rising yields, yields might see a very sharp correction.
Metals
Copper has rallied very sharply over the past few days. Precious metals rallied on the news of potential Trump win - fear trade, but since then have declined. This decline was a significant intra-day reversal. But the overall trend in metals remains up.
Gold could continue to rally in anticipation of a higher inflationary environment. So will the gold stocks. Gold and Silver are tracing out very interesting patterns and could have significant upside potential if the can break above 1320 in Gold. We will also discuss the gold pattern in the near future. Past analysis on gold accurately predicted the bottom in October.
Portfolio Allocation:
Our proprietary model has performed extremely well in 2016. It not only kept us in the market during relevant bull phases, it also enabled us to maintain our calm whether during Brexit shock or Trump shocker. Any portfolio that can:
- Yield returns which are uncorrelated to the market
- Save a lot of heart-burn when the market goes against you by 1000s of points whether in futures or cash
- Provide you consistent returns AND
- Mitigate volatility and provides very high Sharp ratio
Tuesday, November 8, 2016
Reasons to be Bullish - From Twitter
Market completed longer term corrective pattern - Higher prices ahead? https://t.co/lyQxShgxmX $SPY $DJIA $QQQ pic.twitter.com/SeQjjd6D9P
— U_S_Thrive (@survive_thrive) November 8, 2016
A rerun chart from last week. VIX now now longer above all its futures contracts. Looks therefore like it was a scary dip, not a downtrend. pic.twitter.com/xyklR0F14r
— Tom McClellan (@McClellanOsc) November 7, 2016
$VIX term structure suggests that we are approaching an inflection point but note that it has spiked much higher in a few cases#volatility pic.twitter.com/s36s0ZnGun
— Babak (@TN) November 3, 2016
Options Traders Ramp Up Put Buying As Fear Spikes - https://t.co/bq51yqoc8t blog by @JLyonsFundMgmt $SPY pic.twitter.com/UGvsSzqECd
— See It Market (@seeitmarket) November 7, 2016
Chart Of The Week (by views): Investors (Over?-)Prepared For Election Volatility (11/1) $VXST
— Dana Lyons (@JLyonsFundMgmt) November 5, 2016
Post: https://t.co/p7piJzdNeI pic.twitter.com/lOpF6pMibP
we have yet to see any panic from the CBOE equity put/call ratio (normalized by dividing 10d/150d MA) $OEX P/C ratio still negative for mkt pic.twitter.com/z2wvkaDdmv
— Babak (@TN) November 4, 2016
Elections and the Stock Market
We have maintained that the stock market remains in an uptrend and no matter how the election results come out, market would continue its uptrend till the time it enters a bear market. Right now there are no indications that the trend has reversed.
In fact, right now, market seems to have completed its ~4 month long sideways action and is on the verge of breaking out of current 2 year old range.
We discussed the market structure in this post few days ago. Following charts shows what was highlighted and what we saw today:
Friday, November 4, 2016
Market Approaches Key Levels
This worsening sentiment is essentially fuel for the market. Sentiment is one fuel which really kindles market rallies. Right now sentiment is at level normally seen at significant market bottoms, and the market structure is now supporting a potentially sharp rally.
Market Structure
Recent investigation of the market structure suggests that the SP500 along with other indices is tracing out a potentially corrective structure of 3 wave decline.
Following chart shows this structure. Wave C (3rd leg) seems like an ending diagonal. Ending diagonals take place towards the end of a market move and give way to a sharp rally. So once the market rallying, it could take-out many of the recent highs.
Similar pattern is visible in almost all major indices. Following chart highlights this structure in Dow Jones Industrial Average
Along side this market structure, stock market indices have also traced more than 50% of their rally since Brexit vote. This shows that recent correct is now very substantial and should be treated as a minor wave 2. If this is wave 2, it will give wave to a very sharp wave-3 rally.
Sentiment
Following charts show sentiment as measured through Fear/Greed indicators and AAII. Both of these measures suggest that the sentiment is in areas where we see significant bottoms.
If interested in free e-mail list or in paid services, please fill-out the form below.
Wednesday, November 2, 2016
Market Trend Remains Up
Markets' sideways action remains intact. Even though in the last couple of days SP500 and US indices saw a relatively sharp decline, it did not impact the overall shape and form of the market.
Market Structure
SP500 is tracing out a diagonal pattern (shown below). One of the criteria of this pattern was to decline below C level, which it did yesterday. Now, the market needs to hold above yesterday's bottom to confirm that this pattern has been completed.
The overall market structure remains very choppy. This choppy action now spans over 4 months, which is a good enough time to correct the market through time. At weekly level this sideways action looks nothing more than a bull flag or pennant formation. And both of these are bullish in nature.
Sentiment
Recent decline has also improve sentiment measures to suggest that a more sustainable rally is possible.
Fear/Greed indicator is at levels where it typically signifies a market bottom.
Similar another indicator just generated a buy signal and could mean that the trend is about to turn to the upside.
Market Classification Model:
MCM for stocks continues to be in a bull market. Therefore, the trend remains up and we will soon see a sharp rally. Even with yesterday's sharp decline, our strategy performed well. While SP500 was down 0.72%, we were up 0.20%. Another proprietary model is suggesting a sharp rally in our strategic allocation portfolio. We will see. So far by the grace of almighty, our proprietary portfolio is up ~20% YTD (after 10 months), which SP500 is up ~6%.
If interested in free e-mail list or in paid services, please fill-out the form below.
Monday, September 19, 2016
Market Review and Next Week
As the week came to a close, the volatility and market range had reduced. In fact, market closed +0.5% for the week. Following chart shows gyrating market behavior of last week.
One thing that we have said many times on this blog is that the market trend determines how the market participants and investors react to headlines. This weekend there were many reasons to sell the market, ranging from bomb blast in NYC to other events in Syria (US and Russia tension). However, if we are in an uptrend all headlines will be interpreted in a positive manner and resolve to the upside.
According to Market Classification Model, stocks remain in an uptrend. And that's the reason why we have neither sold our stock positions nor are planning to sell them till the model turn south. At this point, it will take a sustained substantial decline to do so. However, past week's decline has created enough selling extreme without really damaging the internal structure, that one can treat it as a minor correction in an uptrend.
Next Week
In the coming week, there are many reasons stories that could move the market. Top two news events will be:
- Fed FOMC meeting
- Bank of Japan meeting
Thursday, September 15, 2016
Interesting 5 days in Stock Market
It has been a period through which we can learn a lot of investment lessons and become better traders. For Example:
- Do not panic and stay with the trend
- Market will continue to deliver sharp declines in a bull-market and sharp rallies in bear markets to push market participants on the sidelines or in the wrong direction
- Always remain aligned with the direction of the trend, no matter what the headlines are
How it started!
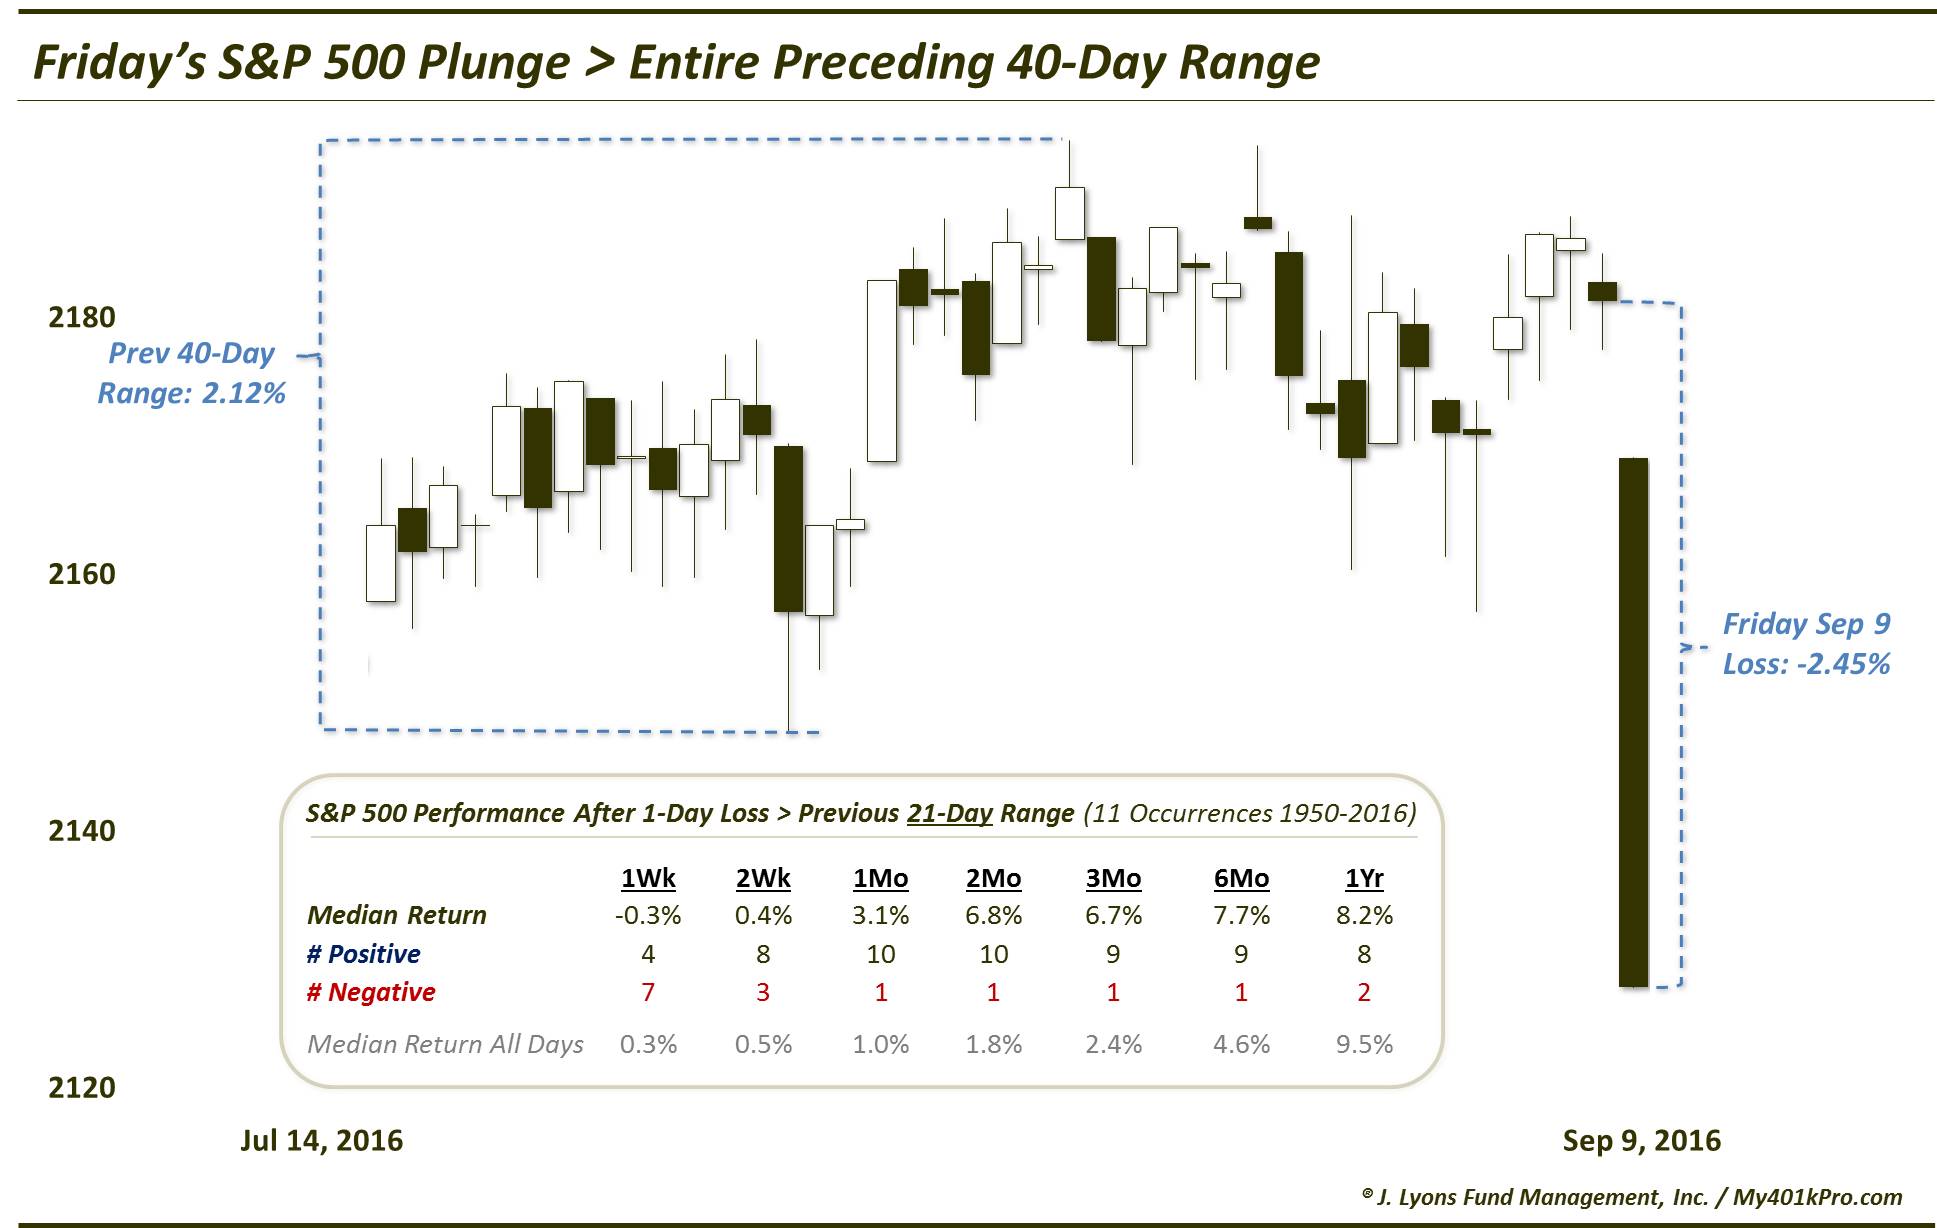
Last 5 days have been nothing short of amazing for the markets. On Friday, September 9, markets declined substantially. The decline was so significant that trading range of 40 days was covered in one trading session.
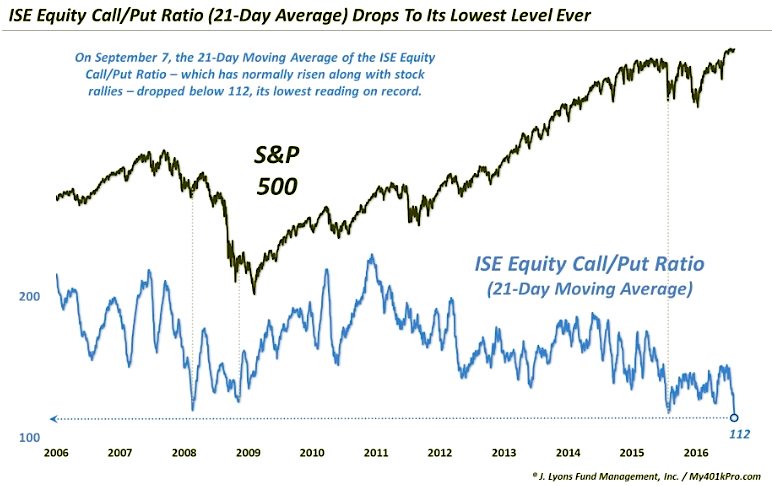
This decline was quite a departure from the dog days of Summer, where market set a record in reduced volatility. By some measures, the volatility was lowest in history. (Charts courtesy of Dana Lyons)
Although many knew that this kind of action is unsustainable, the decline that followed took many by surprise. While everyone was talking about a decline and even we were expecting a decline to shake-out the loose hands, most amusing part was the justification for this decline.
You could see reasons from Fed to emerging markets unwinding, and from valuations to sentiment based complacency. Although all of these reasons are very valid reasons, one needs to thing about these in the context of the market.
Market Trend
According to Market Classification Matrix, a proprietary indicator that uses internal strength indicators that tell us about the strength of the market, we were in a uptrend. And therefore, instead of selling or panicking, we stayed long and kept our cool. No longs were exited.
Our proprietary trading model kept it's long positions. And as September 9th progressed, we realized that this sell-off was generating several buy signals. We will discuss some of the buy signals and the reasons why we think we are just starting the next rally phase, in the next posts. Even though the decline did not result in an immediate bottom for major indices, we saw a sharp rally on Monday after morning decline, which was followed by another two declines on Tuesday and Wednesday.
But the bottom line is that many people panicked while trend remained up. There were very few people who took advantage of the market when it was declining.
Monday, January 27, 2014
IPM Trade Matrix - Trade 2 (Part 3)
By every passing day, market action gives the feeling that this correction could be a start of something big. Market has initiated the 8/4 Test. First step is almost complete with the test of 1770 level. Now the second step would be the Test. If the test fails and market break below critical levels, we will enter a downtrend. By the ways things are going right now, we might enter a downtrend in February.
Trade 2 Complete
TRADE - 1: Summary of Trade 1 (Long) = +2.6%
TRADE - 2: Summary of Trade 2 (Short) = +9.3%
Long TZA (short ETF) at 16.85 ==> Exit at 18.41 ==> +9.3%
Short positions were added on 1/23/14 and 1/24/14 based on IPM Top window expiration and subsequent break below critical level (Trade 1 - risk realized)
TRADE CONDITIONS
Condition: High within IPM turn window - Top. Next IPM window is a Bottom and is 3+ weeks away.
Trigger: Decline below 1835 (SP500), below 16400 (DJIA) and below 2473 (Global Dow)
Supporting Indicators: Lack of proprietary momentum thrust in upwards direction, Influence of weekly IPM and High within IPM turn window
PROFIT TARGETS
Profit Target 1: 1770
Profit Target 2: 1724
Note: Exited all positions at Profit Target 1 because of Rule # 3: Exit all shorts at Target 1 if decline continuation signal is not present from proprietary momentum indicator and buy signals generated by key indicators. Moreover, Elliott Wave count is close to near-term completion. Re-evaluate situation in next 2-3 days to be ready for another short entry.
RISK
Stop: Rally above SP500 = 1849, DJIA = 16498, Comp = 4246, Rut = 1181 (3 of 4)
Trailing Stops: SP500 = 1836, DJIA = 16310, GDOW = 2470 (Trailing stops will be updated next week - 1/31/14)
Typical IPM Trade Matrix Risk: 1.5%
Actual IPM Trade Matrix Risk: N/A
Risk Reason: No significant risk because upcoming turn date is a bottom.
Applicable Rule: If short with last IPM ~2 weeks ago & next IPM a bottom, review proprietary momentum indicator (combination of 5 indicators). If momentum = 1, stay till Profit 2, else exit all at profit 1 and re-enter later.
Note: IPM Trade Matrix Trades will be posted in the first half of 2014. This is an experiment to understand and enhance the capabilities of this Matrix.
Thursday, January 23, 2014
IPM Trade Matrix - Trade 1 (Part 7)
Market is still going sideways. This kind of market action suggests that the market is getting ready for a blast higher. Although yesterday's Chinese PMI data will be brought forward as a reason of concern and the sell-off, there is nothing wrong with the market structure suggesting that this news will also be bought.
First Trade of 2014 is in process:
Trade Observations
- IPM Top date did its job, as market went sideways after topping on that date. IPM Top date was scheduled for Jan 15 and the latest market top did occur on Jan 15. We will see if market can break above this top to mitigate all the risks!
- Although DJIA did close below its trailing stop, other indices did not close below their respective levels. As a result, we are still long and have not been stopped out.
- As we come closer to the next IPM turn date, we will take profits even if the market did not reach our target. But that time is few weeks away. So market has ample time to show its real character.
Markets
SP500 (1/22/14) = 1845
DJIA (1/22/14) = 16375
TRADE
Long TNA at 76.25 (original) ==> 76.6 (new)
Long FAS at 92.30 (original) ==> 91.6 (new)
Long TSLA at 171.2
Long positions were added on 1/14/14 & 1/16/14 based on IPM Bottom window expiration and low risk scenario
Condition: Next IPM Window is Top or Bottom
No. of Trades between turn windows: 1
Triggered (Updated at End of Day on 1/9/14): Rally above 1837 (SP500) and above 16450 (DJIA)
Profit Target: 1885-1890 (Will be evaluated as Elliott Wave structure matures)
RISK
Stop: Below SP500 = 1816, DJIA = 16217, Comp = 4090, Rut = 1141 (3 of 4)
Trailing Stops (updated on 1/23): Close Below SP500 = 1835, DJIA = 16442, Comp = 4170, Rut = 1160 (3 of 4)
Typical IPM Trade Matrix Risk: 1.5%
Actual IPM Trade Matrix Risk (1/15/14): 0% (Entry = 1837, Exit = 1835, Risk = 0%)
Risk Reason: IPM Top is approaching. Market needs to hold during this top window, otherwise we can see a serious correction. Rise above 1850 will neutralize this risk
Applicable Rule: If next minor IPM turn window is within 2 weeks then wait for a confirmation break before exiting longs.
Note: IPM Trade Matrix Trades will be posted in the first half of 2014. This is an experiment to understand and enhance the capabilities of this Matrix.