Still Long market. Market is in a trending mode at this point in time. And we could see another rally phase starting very soon.

- Reading > 50: Market is approaching a bottom
- Reading < -50: Market approaching a Top
- -50 < Reading < 50: Market is trending => Current trend per 8/4 test will continue
IPM Trade Matrix 2014 Trades
TRADE - 1: (Long) = +2.6%
TRADE - 2: (Short) = +9.3%
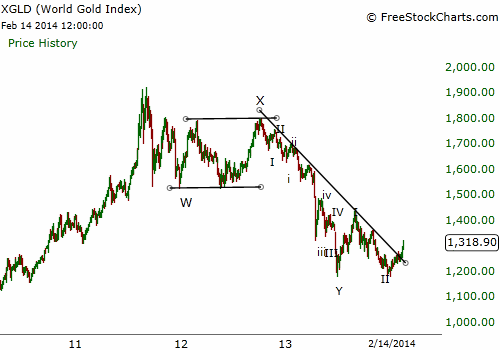
TRADE - 3: (Long) - Non IPM Trade Matrix trade = -0.2%TRADE - 4: (Short - 1/31/14 to 2/5/14) = +7.25%
TRADE - 5: (Long) = +9.8%
TRADE - 6: Long
Long TNA at 69.94 ==> 72.75 (added longs) ==> 74.85 (added longs)
Original trade 6 longs were initiated on 2/7/14 based on IPM Trade Matrix Trigger. More longs were added on 2/24/14 and 2/26/14.
TRADE CONDITIONS
When: Outside IPM Turn window.
Trigger: EW pattern completion. Current pattern suggests that the correction is over or will soon be over. Rally above SP500 = 1851, Global Dow = 2472
Supporting Indicators: Up trend, Next IPM turn window is a Top, Next IPM Turn Window is 1-2 weeks away, Rise has been impulsive in nature
PROFIT TARGETS
Profit Target 1 (SP500): 1908
Profit Target 2 (SP500): No target # 2 on 2nd trade
*TNA profit objectives might be different than SP500
RISK
Stop: Break below SP500 = 1810, DJIA = 16000, GDOW = 2440
Trailing Stops: Will be updated by Friday (2/28)
Typical IPM Trade Matrix Risk: 1.5%
Actual IPM Trade Matrix Risk: 2.2% (Entry = 1850, Exit = 1810, Risk = 2.2% )
Risk Reason: No significant reason for concern. Market needs to hold critical levels and we will see higher levels
Applicable Rule (There are 7 Rules in the IPM Trade Matrix):
Note: IPM Trade Matrix Trades will be posted in the first half of 2014. This is an experiment to understand and enhance the capabilities of this Matrix.
RISK
Stop: Break below SP500 = 1810, DJIA = 16000, GDOW = 2440
Trailing Stops: Will be updated by Friday (2/28)
Typical IPM Trade Matrix Risk: 1.5%
Actual IPM Trade Matrix Risk: 2.2% (Entry = 1850, Exit = 1810, Risk = 2.2% )
Risk Reason: No significant reason for concern. Market needs to hold critical levels and we will see higher levels
Applicable Rule (There are 7 Rules in the IPM Trade Matrix):
- Do not go long or short without trigger to prevent losses by market moving against you.
- Exit all at profit objective 1 because its the 2nd trade with IPM Turn window.
- No Trade in opposite direction
- Observe stop-losses to minimize draw-downs
- If stops are hit ==> Wait on the sidelines for new opportunity near IPM Turn window
For Blog updates on Google+ add: Understand Survive Thrive
For Blog updates on Twitter, add: @survive_thrive
For E-mail updates: