Twitter

Showing posts with label Stock Market forecast. Show all posts

Tuesday, February 7, 2017

2017 Investment Themes

There are many prominent investment themes for 2017. Investment themes help investors understand the broader investment landscape based on historical performance of different asset classes and their current catalysts. This analysis helps in properly positioning one's portfolio to take advantage of the winds of change.

US Stock Market

SP500 and DJIA have experienced an amazing 1 year rally. Since Feb 2016, markets are up ~30%. With such a sharp rally, it won't be wrong to expect a sideways/downward market correction. Since corrections can come in different forms, sideways correction with time will help in digesting last year's gains just like a sharp fall in prices.


Lofty price levels can be supported by equally good earning numbers, which can provide further fuel for the rally. However, with the uncertain political dynamics in the U.S. we should be prepared for any sudden decline in the US stock prices like 1987 market crash - not a certainty but a word of caution.

Note: Next earnings will be reported in mid-April 2017


Emerging Markets

On the other hand, emerging markets finished a 5 year long correction in 2016. As US markets rallied, emerging markets corrected from 2011 to 2015. Since bottoming in 2016, emerging markets have rallied and looks like they have formed an inverted head and shoulders pattern. Once they breakout, emerging markets could go up to there 2011 highs. Therefore, this is an area to keep in mind.


Precious Metals

Gold had been declining since 2013. It bottomed in early 2016 and then rallied sharply. However, since mid-2016, Gold has again experienced a major pullback. However, we think that this pullback is a buying opportunity and would result in higher prices. 

Following chart shows a potential inverted head and shoulders pattern being formed by gold. Once this pattern is complete, gold can make an advance towards all-time highs around 1900. However, the first target would be to reach July 2016 highs. Therefore, gold is an area which one should keep on his/her radar for investment opportunities.


Precious metals are also influenced by the US dollar. US dollar has rallied very significantly over the last two years or so. Therefore, as the US Dollar corrects, it will provide fuel for a rally in the precious metals complex.

Bonds

Bond have been in a long-term bull market. In fact, its one of the biggest bull markets in history of bond prices. However, the bond price cycles are turning and so are the prices. Now the question is whether the Bond Bull has ended or it still has some life left.

Bond prices started declining in mid 2016 and have reached a critical area. Prices should reverse to the upside soon or they will mark the end of the Bond bull, which can be disastrous for the debt-laden global economy. We will keep a tab on the Bond market to understand clues for the future of the US economy.


Investment Options

We are working very hard to make these strategies available for investors. If you are interested in investing, you can register below and we will send you update when the strategy is available for investments. Some of the key outputs from the data models used in this strategy are also available through subscription

Monday, October 17, 2016

Market Timing (IPM Model) & Structure

Just re-ran the Inflection Point Model and it seems like the next turn window is approaching fast. It is scheduled for October 21, 2016 (shown in chart below)
As you can see from the above chart, last turn window was on Sept 26, 2016. And the market topped on Sept 22, 2016, followed by ~3 weeks of sideways action. Following chart shows the best market structure representation with latest timing information


Market is still in a sideways correction. In fact, the 2nd portion of this correction took the shape of a triangle (X). Now it is in the final leg of this decline. So far, this last leg of the decline has been tracing out 3 waves, which means that this might turn into an ending diagonal.

Last wave will be sub-divided into 5 parts. 2 of 5 have been completed. The market could bottom in the area of 2090-2065 (SP500).

A signal of bottom will be generated by a buy signal generated within the IPM turn window. Confirmation will be received by a rally above critical proprietary levels.

Overall market trend remains up and this correction should give way to a sharper rally. Seems like market is setting-up for a wash-out to scare enough people out of the market, so that a big year end rally can start.

If your already long, stay long. If you want to go long, wait for another few days and then start adding longs.

Market Classification Model
Market Classification Model (MCM) remains bullish on the US stock market. It turned bullish in July 2016 and has remained bullish through last 3 months. Even though many market pundits have been advocating a sharp decline.

Persistent investment behavior is critical for longer-term capital gains because that's the best way of gaining preferred tax treatment, which can significantly help your portfolio.

If interested in free e-mail list or in paid services, please fill-out the form below.

Thursday, September 22, 2016

Correction Complete - Approaching Vacuum

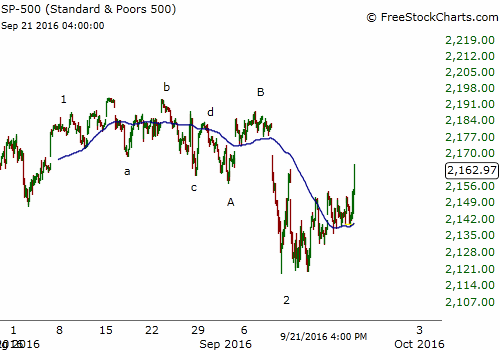
Near term market structure suggests that market has just completed a correction. With intermediate trend up and recent sell-off triggering several buy signals, it seems like we are on the cusp of a major rally.

Following chart shows the correction count, since early August.


Since August 8th markets have gone sideways. This sideways action culminated on 9/9 with 400 point decline in DJIA. If the market had rallied right after September 9th bottom, people would have accepted this bottom easily. But sideways action over the past week of so with federal Reserves uncertainty really pushed many market participants out of the market.

Next wave would be wave -3 and a sharp rally. Furthermore, market is now entering Vacuum territory.

Vacuum in Nasdaq
After consolidating near all-time highs for almost 2 years, Nasdaq is about to really break out. This break above 16 year highs, puts Nasdaq in unprecedented territory.

Following chart shows that there is Vacuum above this level and could suck the market higher and leave many of the market participants behind.


Believe me its a very difficult thing to buy at all-time highs. And that's why we developed a strategy to align with the trend with proprietary Market Classification Model, in conjunction with tactical allocation and strategic evaluation. This model has performed amazingly well since it's launch on January 1, 2016 (Performance). 

If interested in free e-mail list or in paid services, please fill-out the form below.


Friday, January 15, 2016

Bonds Bull is Roaring

We have been discussing stock market's #Bear and Bond market's #Bull for a while. Now it seems like Bond market is really taking-off. This is evident from a sharp rally in the bonds over the last 2 weeks. Some might attribute it to the declining stock market but a bull market keeps on rising and people find reasons for the rise.

As a confirmation of the trend, bond prices have just completed an inverted Head and Shoulders pattern (shown below):


We have been discussing this pattern since December, as following charts was published here on December 21.


As bonds rally and stocks decline, we are short stocks and long bonds. Being long bonds gives us cash flow in form of dividends and being short stocks allows us to take advantage of the downside.

Like any market, this bond rally will come across obstacles but the constant cash flow and the diversification provided by this investment is invaluable, along with the potential for capital gains. At the same time, it will provide a very good opportunity and probably the last opportunity for people to buy homes at very low interest rates.

As market gets more volatile, it will even make more sense to invest in bonds. But the good time to invest in any asset class or stock is before the major move happens and the news becomes public. Let's see when the stock market bounce happens, which might provide added insight into the long-term (6 months to 1 year) market trajectory.

After all is said and done, there will be a very good opportunity to buy stocks down the road.


Friday, September 20, 2013

Fed Decision & Gov't Shutdown: This Time Its Real (Part 2)

Part 1

This question suggests that either Fed does not think the economy is strong enough right now, which means there is some thing fundamentally wrong. Or they are anticipating a major shock in the near future. This leads us towards the upcoming budget discussion and possible government shut-down starting on October 1, 2013.

I think Federal Reserves' was looking ahead and they saw a real policy of a government shutdown in October, along with another long-drawn battle on debt-limit increase. That is why, they preemptive these political uncertainties by giving another doze of steroids to the market so that the impact of political stalemate does not ripple through the stock market, and consequently does not derail the nascent economic recovery.

As far as the political stalemate is concerned, this time it will be bad! On all previous occasions politicians started working on the debt-ceiling / government shutdown issues at least ~2 months in advance, with media shouting about this possibility ~3 months in advance. For example, in 2011 debt-ceiling was being discussed in the media in April/May time frame, months before the actual stock market decline in August.

But this time, it is different. Today, was the first time I saw something on the news about a potential government shut-down in a financial news outlet. This means that lawmakers are not taking this shut-down seriously with only 2 weeks left to the the shutdown. This will be followed by debt-ceiling debate, which needs to be settled in less than a month. And finally, since Republican lawmakers have been burnt by sequestration earlier this year, it is highly unlikely they will easily cooperate on this issue.

All of the above mentioned scenarios combined, suggest that there a lot of headwinds for the market in the near future. Under these circumstances, we will analyze the IPM model for trade timing  

Thursday, September 19, 2013

Fed Decision & Gov't Shutdown: Logic Behind Fed's Decision (Part 1)

So everyone was surprised by what Fed did yesterday. In fact, it is one of the times after a long time that I have seen so many people caught off-guard. Since I was expecting the market to go up after the announcement of the taper, I was not surprised by the rally after the announcement. I was surprised by the announcement to not taper. And to be sure, this surprise was equally shared between financial news media and economists. Since the surprise decision is now out, the question remains about the context of this decision.

In real world economists, Federal Reserve's officials, treasury analysts and central bankers typically make policy decisions based on fundamental analysis of macro-economic indicators. These indicators tell them how to manage their policy to control inflation, foster job growth and spur economic activity. Therefore, it will be very insightful to analyze the implication of federal reserve's recent decision of "not to taper" from a fundamental & socio-economic perspective.

For one, since everyone was expecting a taper decision. "Not Taper" turned out to be a perfect contrarion trade.

On the other hand, from a fundamental perspective the consensus was that Fed will start tapering its bond buying program in September 2013. And the reason behind this assumption was the language used by Fed's officials over the recent meetings was getting Hawkish. In these meeting's Fed's officials had started becoming "Hawkish" about the fiscal policy i.e. they were getting concerned about the potential increase in the inflation rate due to extremely accommodating monetary policy.

Behind the shift in Fed's language towards stricter monetary policy was recent economic data which was hinting towards robust economic growth in the US economy, along with significant gains in the housing market and stock indices. However, this data was available to the general public all over the world, and the data did not get worse over the last month or so.

Therefore, the question is: "What did the Federal Reserves' see differently during the September's FOMC meeting, which forced them to keep the extraordinarily accommodative monetary policy intact?"

This article will continue in next part ...

Tuesday, November 6, 2012

Stock Market & Presidential Elections 2012


Our lives and our decisions are governed by our moods. We live as per our mood (socialize if we are happy, stay introvert when depressed), we eat according to our mood (spend when we think we have money and are happy, or sleep with a just Ramen noodles when we are tired or are not affluent), and spend what we feel like. In short, our actions are governed by our mood swings. In the same respect, we vote as per our mood i.e. if we feel good, we vote for the incumbent. On the other hand, if we feel bad, we register revolt through our vote. In other words, voting is the best representation of the collective social mood of a society.

Another way to analyze the social mood is through the stock market, because Stock Market is the barometer of the broader social mood. When market rises, optimism increases and when it declines, pessimism saturates. This cyclic behavior is so common that it gave way to the contrarian trading strategies. This is because society’s collective optimism peaks near the top, while collective fear peaks at the bottom. Although there are many ways of measuring the sentiment, this article will address the relationship of people’s vote and the broader social mood.

At this point it is clear that both Stock Market and Voting exhibit social mood. The only caveat is the delay between the social mood exhibitions through the Stock Market VS Voting. If one wanted to assign a timeline to social mood exhibition, Stock Market would be the first responder, while geo-political events will be the last responder. This is because the social mood pushes the society to take actions in accordance with the broader social mood. These actions range from Voting out the incumbent leader to starting a War with another country. The interesting to keep note of is the fact that this social mood change is typically displayed through the stock market price pattern.

Now, if we look at the current situation from the stock market perspective (shown below), it is very clear that the market has been rising under President Obama’s administration. In fact the market has more than doubled under Obama since March 2009.
DJIA: 6500 ==> 13500
Gold: 900 ==> 1800
Oil: 35 ==> 90

This stellar stock market and commodities market performance along with the latest consumer confidence reading (consumer confidence is touching 4-year highs) and the low VIX numbers, clearly suggest that the social mood is very optimistic. Although we know that these 100% gains are a factor of prior market collapse, the short-term memory of the populous will allow these gains to work in the favor of the president. 

In past, when mood has been this optimistic, we have rarely seen an incumbent losing the elections. In other words, no matter how bad President did during his tenure, he has done enough good to keep the asset prices afloat, avoid a second recession and bring back optimism among the masses about the future of the country. Therefore, from a stock market and social mood perspective, President Obama is the favorite to win today’s presidential elections.

However, if the President loses today, it would mean that elevated stock market prices are not the sole representation of the Social Mood. And that people do take into account their personal situations when dealing with things like elections.

Next Post: Implication of Election results on the Stock Market (An Elliott Wave perspective)