Twitter

Showing posts with label Stock Market Crash. Show all posts

Tuesday, March 28, 2017

Financial Media and Stock Market

Over the last week, Financial News media is talking about how Trump will not be able to keep his promises given current political situation. Hence, continuation of the "Trump Rally," as it has come to be known, is in jeopardy. However, this is not correct and this is my problem with the media. News media needs a story and reports on everything after the fact because that is what majority of their readers can relate to.

They have done the same thing over and over again. Three big examples from 2016 include Brexit, US Elections and Oil crash of early 2016. In case of Brexit and US Elections, media did not have clue of what will happen in the actual vote. Everyone was complacent about status-quo remaining intact and no changes taking place. For example, UK staying in EU, while Hilary winning the White House.


Once both of these predictions turned out to be wrong, they focused on how negative will this development be for the overall stock market because of nationalistic policies, lack of growth and other issues. However, the market proved them wrong every time. And then they cam up with rational behind Trump rally or Post-Brexit stock market rally. These reasons range from additional liquidity by central bankers or business friendly presidency.

Brexit
US Elections
However, if you think about it for a minute, what would have happened had we seen the opposite results in Brexit Vote or US elections?
  • Brexit Vote: A vote to stay as part of EU would have also triggered a stock market rally but the rationale would be - it's a relief rally!
  • US Elections: A vote for Hilary Clinton would have also triggered a market rally with a rational of policy continuation and lack of uncertainty  
In either case we would have experienced higher prices but different rational. Therefore, financial news media had no idea regarding the cause of the rally and didn't know that the market would rally. They just react to market performance and come-up with justifications. If one had been following the financial media and acting accordingly, they would have lost a lot of money or at least had not participated in the market rally.

And right now, media is so focused on negative aspects of Trump administration that it is missing several opportunities. We discussed some of these opportunities, as part of our 2017 investment themes in February (link).

In order to mitigate this news driven emotional roller-coaster, we developed proprietary portfolios, where investors can invest for longer-term consistent gains without involving emotions due to financial news media. For example, we exited the stock market in Sept 2015 and then entered the market again in July 2016, and have maintained long positions since then.

Following is an overview of the performance. Detailed performance will be shared after end of Q1:
  • Conservative: ~7.5%
  • Aggressive: ~18.5%

Want to Invest?

At Understand, Survive and Thrive, our goal is to produce consistent, uncorrelated returns using unique analysis techniques, that will enable your portfolio to beat the market over any economic cycle and provide peace of mind. We don't believe in beating SP500 every single month. And therefore, if someone wants to try our strategies just for the short-term, we will suggest that they will be disappointed at some point.

If you are interested in investing, you can register below and we will send an update. Some of the key outputs from the data models used in this strategy are also available through subscription.

Wednesday, January 13, 2016

Nasdaq Head and Shoulders Completed

Market is declining and Head and Shoulders have played out exactly in Nasdaq. We are in a #bear and we have been discussing this scenario since August 2015. 
 
Following chart was presented on January 4, 2016 (link).


Market so far has played out Head and Shoulders pattern to the target, as shown below.


Head and Shoulders patterns are forming in many other asset classes. We will review these in the next few blog posts.

Friday, May 8, 2015

Portfolio Positions - Dollar Tree

Sideways action continued this week also. This sideways action can be very demoralizing for regular market watchers, as no one really knows what will happen next. But there is a famous phrase on the street, which says that "one should not short a dull market." Although this market is not dull on a day-to-day basis, it has been pretty dull over the last few months.

Good investors make money in these type of markets by selling stocks that have already rallied during this phase and re-distributing proceeds into positions which have not performed so well. In this way, they are better positioned to take advantage of potential rally.

A very good example in this regard is Amazon. Amazon declined throughout 2014 after topping around 400 in late 2013. While Amazon was declining, it was a good opportunity to accumulate. Since Amazon was in a bull market based on proprietary model, adding to long positions paid off big time in 2015 with Amazon rallying from 300 to 430 in just 4 months. Therefore, the gains would have been amplified, as one would have bought multiple shares at lower price.

The goal of the new model is to buy good businesses that actually sell tangible products or services. This would mean that investors are actually investing in good companies.

The most recent example in model portfolio is Dollar Tree stock. Dollar Tree rallied in the first two months of this year, but since then it has been declining. As a result, proprietary allocation model increased the exposure in Dollar Tree in May because it is in a bull market. Model will keep on changing the ratio based on analytic modeling, as long as the stock remains in a bull market.


If the stock is truly in a Bull market, it will rally sooner or later and thus, gains will be amplified. If not in bull market, portfolio will exit the stock position on proprietary triggers. We will see...


Saturday, April 25, 2015

Lessons from Nasdaq and Beating the Market

Last week was a positive week for the overall market. Blue chips gained some but Nasdaq gained a lot. Nasdaq is now within few points of all time high, which was set in 2000.

Although Nasdaq (the darling of 90s) is now approaching all-time highs after 15 years, many of the companies that were making higher highs in early 2000 are no where to be found in today's market. If one had invested in selected few companies, he would still be at a much lower level.

The story of Nasdaq taking 15 years to reach its all-time highs, teaches us two important lessons:
  1. Market can remain below a certain level for eons. Therefore, buy and hold might not be the best strategy
  2. Individual stocks are extremely hard to manage because of their individual unique profiles, company cultures and other aspects
Being said that, now the question arises how can one then beat the market and should one hire a money managers, with ton of market experience, to beat the market. Lets tackle both of these questions one by one:

Firstly, over the long-term (~20 years) only 1-2% of the money managers beat the market. This means that the probability of selecting a winning manager is .02. In other words, if you have the choice of investing money with 100 money managers, only 2 will be able to beat the market over the long-run. Furthermore, all of them will take money management fees. So should one invest with money managers with such low odds of success?

This observation gives credence to Warren Buffet's concept that its better to invest in low cost ETFs that follow the market and at least perform better than majority of the money managers because you will be closely following market's performance. But this method does not answer the question of how to beat the market. Although it is a difficult question to answer, it is a very good question to ask!!

In order to beat the markets, one should buy good companies and ride them as long as they perform well. If they enter a bear market, one should start riding another well-performing company. Although this concept seems very simple, it is very difficult to implement. In order to effectively implement this concept one needs following 5 pieces of information:
  1. Which companies to invest in?
  2. Whether selected stock is in a bull or bear market?
  3. How much to invest in each position? 
  4. When to exit a certain position?
  5. How to protect gains? 
As you know Understand, Survive and Thrive has been performing market analysis over the past several years with the goal to optimize portfolio returns using objective techniques and algorithms to take out emotions from trading. We have recently tried to incorporate above mentioned 5 pieces into our model for long-term investing.


Wednesday, February 19, 2014

IPM Trade Matrix Update - Trade 5 (Part 5)

Trade Overview
Today's market action was very constructive. While on one hand large caps like DJIA and SP500 absorbed recent gains by going sideways, small caps and tech stocks rallied sharply. This rally in small caps is a very encouraging sign for the broader market rally. Furthermore, breadth during this rally has been very impressive. 

Following chart shows a smoothed Advance/Decline line. According to this chart, market breadth hasn't been this strong in a while. 

Please note that this chart has two implications:
  1. We won't enter a new bear market right away i.e. current rally has a ways to go: 1929 comparison should not be taken seriously
  2. We might be approaching an overbought area and could see a pull-back over the next couple of weeks.
This chart also confirms IPM Trade Matrix's buy signal. The only difference is that the IPM Trade Matrix generated its signal several days before the breadth jump. Therefore, IPM Trade Matrix is a real-time actionable system with greater profit possibilities. 

Our Elliott Wave structural analysis of the market suggests that the market is in a firm uptrend. We are at least a week away from an intermediate term correction. Please note that this will not be a serious correction. It might just fill-out the right shoulder of the Inverted Head and Shoulder pattern (discussed earlier). IPM Top date has already been e-mailed to subscribers.


As evident from the above chart, market has just completed a sequence of 1s and 2s. As long as the stop levels are not broken (outlined below) we will stay long. If profit objectives for TNA are hit, we will bring our trailing stops closer per IPM Trade Matrix definitions and will let the market decide its next move.

Elliott Wave analysis cannot be completed without sentiment analysis. And current sentiment analysis suggests that we are still not seeing optimism in the market. This is  very good for the health of this rally. We will keep an eye on the stop levels and profit objectives, as we are approaching the end of Trade 5 per IPM Trade Matrix.


IPM Trade Matrix 2014 Trades

TRADE - 1: (Long) = +2.6%
TRADE - 2: (Short) = +9.3%
TRADE - 3: (Long) - Non IPM Trade Matrix trade -0.2%
TRADE - 4: (Short - 1/31/14 to 2/5/14) +7.25% 

TRADE - 5: Long
Long TNA at 70 ==> new TNA basis = 69.94 (added few longs today) 
Longs were initiated on 2/11/14 and 2/13/14 based on IPM Trade Matrix Trigger and Elliott Wave structure. More might be added if opportunity comes within IPM turn window. 

TRADE CONDITIONS
Condition: Bottom within IPM Turn Window  
Trigger: Rally above SP500 = 1789, DJIA = 15790, Russell 2000 = 111.5, Global Dow = 2401
Supporting Indicators: Up trend (8/4 did not complete), Next IPM can be either Top/Bottom

PROFIT TARGETS
Profit Target 1: 1870
Profit Target 2: 1930

RISK
Stop: Break below 1750 (valid till we are within IPM Turn Window)
Trailing Stops: Break below 1790 (SP500) and 15780 (DJIA)
Typical IPM Trade Matrix Risk: 1.5%
Actual IPM Trade Matrix Risk: 1.3% (Entry = 1813, Exit = 1790, Risk = 1.3% )
Risk Reason: There are multiple reasons to be worried: 1929 stock market parallel, 8/4 Test to the downside is in process (will be invalid at new highs) - almost invalid, and major IPM Bottom window in process - almost invalid.  

Applicable Rule (There are 7 Rules in the IPM Trade Matrix. Following are applicable to the market right now): 
  1. Do not go long or short without trigger to prevent losses by market moving against you.  
  2. Exit half at profit objective 1. Exit full at profit objective 1 if proprietary momentum continuation signals are not present.
  3. Observe stop-losses to minimize draw-downs

Note: IPM Trade Matrix Trades will be posted in the first half of 2014. This is an experiment to understand and enhance the capabilities of this Matrix.


For Blog updates on Google+ add: Understand Survive Thrive 
For Blog updates on Twitter, add: @survive_thrive
For E-mail updates: 

Sunday, February 16, 2014

IPM Model Update & Gold Breakout

IPM Model Update Has Been E-mailed to Subscribers.

IPM Trade Matrix Updates: IPM Trade Matrix Update - Trade 5 (Part 4)

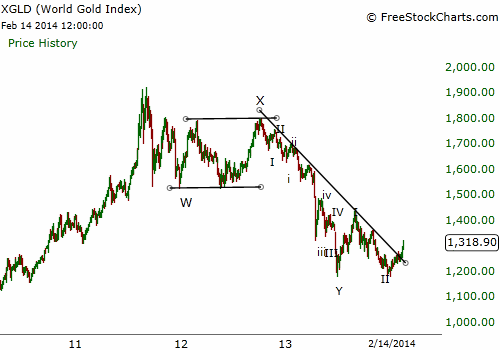
Gold & Silver are breaking out. There are several reasons to be optimistic about their prospects:
  1. 8/4 Test has been completed to the Upside in both Gold and Silver on both dail and weekly time frames. This suggests that the trend has reversed, and we should start looking for upside surprises. 
  2. Long-term trend lines have been broken to the upside.
  3. Sentiment had reached pessimistic extreme few weeks ago, which was in line with a generation precious metal bottom
  4. Bottoming process took its due course which is encouraging for the market
  5. Miners have really started out-performing the metal. This is another exciting and encouraging sign.
  6. Rally from the bottom has been impressive, and suggests a new trend has started.


Confirmation of a new Bull market will be a rally above 1460 in Gold.


For Blog updates on Google+ add: Understand Survive Thrive 
For Blog updates on Twitter, add: @survive_thrive
For E-mail updates:

Wednesday, February 5, 2014

Markets Overview and Further Decline Possible

Yesterday's sideways action flows very nicely with the wave 4 argument. Wave 4s give way to wave 5. Therefore, we should expect another down draft in the very near future. Following chart shows the updated market structure.


In order for this structure to remain valid, market should stay below 1770. Once we break below recent lows and enter the 1730 area, we will near the end of Wave 3 of a higher degree. SP500 target levels is between 1722 and 1730.

This 5-wave completion could have two possibilities:

  1. Immediate sharp rally
  2. Immediate rally but more of a sideways market action, followed by another low
  • Scenario 1 would mean that markets will likely rally to new all-time highs.
  • Scenario 2 would mean that markets have entered a downtrend and one should be careful of rallies. 
From a Market Matrix perspective, it seems like market wants to decline to lower levels and this decline is not over yet. Sentiment is also not showing pessimistic extremes. Above all, one should wait for the IPM Turn Window to pick the bottom. Therefore, we will keep on analyzing the market for further clues and see how things evolve. This analysis will help us in next IPM Trade Matrix trade.

Please note that latest IPM Trade Matrix trades have been updated on the blog at: 

IPM Trade Matrix - Trade 4 (Part 3)


Tuesday, February 4, 2014

IPM Trade Matrix - Trade 4 (Part 3)

IPM Trade Matrix Trades

TRADE - 1: (Long) = +2.6%
TRADE - 2: (Short) = +9.3%
TRADE - 3: (Long) - Non IPM Trade Matrix trade = -0.2%

TRADE - 4: Short - Still holding short since 1/31/14
Long TZA (short ETF) at 18.23 ==> 18.57 (shorts added) 
Short positions were added on 1/31/14, 2/3/14 and 2/4/14 based on Elliott Wave structure and break below critical levels. 

TRADE CONDITIONS
Condition: Outside IPM Turn Window (Re-entry)
Trigger: Test of ~1785 (SP500) and decline below 1769 (SP500). Decline trigger was based on EW analysis and other proprietary levels. 
Supporting Indicators:  Initial decline was impulsive (5-wave). Next IPM window is a Bottom and is 1-2 weeks away. Details of IPM turn window e-mailed to subscribers. 

PROFIT TARGETS
Profit Target 1: 1725 - 1730
Profit Target 2: 1670 

RISK
Stop: Above 1770
Trailing Stops: 1770 - Based on Elliott Wave analysis (will be updated on a regular basis)
Typical IPM Trade Matrix Risk: 1.5%
Actual IPM Trade Matrix Risk: 0% (Entry = 1785, Exit = 1770, Risk = No Risk)
Risk Reason: No significant risk because upcoming turn date is a bottom.

Applicable Rule: Do not go long or short without trigger to prevent losses by market moving against you.  


Note: IPM Trade Matrix Trades will be posted in the first half of 2014. This is an experiment to understand and enhance the capabilities of this Matrix.

Monday, January 27, 2014

IPM Trade Matrix - Trade 2 (Part 3)

Market Overview
Recent market action has not only validated the accuracy of the Inflection Point Model (by the grace of God), it is also supporting the argument that the IPM Trade Matrix is a robust trading mechanism because it can adapt to different market conditions in advance (like it did recently). The goal of IPM Trade Matrix is to make trading a system with out emotions and generate consistent results. Consistency is the key to success in the world of investing.

By every passing day, market action gives the feeling that this correction could be a start of something big. Market has initiated the 8/4 Test. First step is almost complete with the test of 1770 level. Now the second step would be the Test. If the test fails and market break below critical levels, we will enter a downtrend. By the ways things are going right now, we might enter a downtrend in February. 

If market does enter the downtrend, we would have to switch to the Downtrend section in the IPM Trade Matrix. This would mean that we will enter one more trade by the next IPM Bottom window.  

For the time being, market's structure is nearing completion before rallying for few days. Near term structure looks very impulsive. Whereas, in SP500 it is missing only one more down move before the rally can start, wave structure looks complete for Nasdaq and Russell. 


It is possible that the rally might start on the Fed's news and might till the end of January. We will continuously evaluate the market structure to identify critical levels for counter-trend rally completion. But if January ends negative, there is a very high probability that it will be bad for the entire year. 


Trade 2 Complete 

TRADE - 1: Summary of Trade 1 (Long) = +2.6%

TRADE - 2: Summary of Trade 2 (Short) = +9.3%
Long TZA (short ETF) at 16.85 ==> Exit at 18.41 ==> +9.3%
Short positions were added on 1/23/14 and 1/24/14 based on IPM Top window expiration and subsequent break below critical level (Trade 1 - risk realized)

TRADE CONDITIONS
Condition: High within IPM turn window - Top. Next IPM window is a Bottom and is 3+ weeks away.  
Trigger: Decline below 1835 (SP500), below 16400 (DJIA) and below 2473 (Global Dow)
Supporting Indicators: Lack of proprietary momentum thrust in upwards direction, Influence of weekly IPM and High within IPM turn window
PROFIT TARGETS
Profit Target 1: 1770
Profit Target 2: 1724

Note: Exited all positions at Profit Target 1 because of Rule # 3: Exit all shorts at Target 1 if decline continuation signal is not present from proprietary momentum indicator and buy signals generated by key indicators. Moreover, Elliott Wave count is close to near-term completion. Re-evaluate situation in next 2-3 days to be ready for another short entry. 

RISK
Stop: Rally above SP500 = 1849, DJIA = 16498, Comp = 4246, Rut = 1181 (3 of 4)
Trailing Stops: SP500 = 1836, DJIA = 16310, GDOW = 2470 (Trailing stops will be updated next week - 1/31/14) 
Typical IPM Trade Matrix Risk: 1.5%
Actual IPM Trade Matrix Risk: N/A 

Risk Reason: No significant risk because upcoming turn date is a bottom.

Applicable Rule: If short with last IPM ~2 weeks ago & next IPM a bottom, review proprietary momentum indicator (combination of 5 indicators). If momentum = 1, stay till Profit 2, else exit all at profit 1 and re-enter later. 


Note: IPM Trade Matrix Trades will be posted in the first half of 2014. This is an experiment to understand and enhance the capabilities of this Matrix.

Friday, September 20, 2013

Fed Decision & Gov't Shutdown: This Time Its Real (Part 2)

Part 1

This question suggests that either Fed does not think the economy is strong enough right now, which means there is some thing fundamentally wrong. Or they are anticipating a major shock in the near future. This leads us towards the upcoming budget discussion and possible government shut-down starting on October 1, 2013.

I think Federal Reserves' was looking ahead and they saw a real policy of a government shutdown in October, along with another long-drawn battle on debt-limit increase. That is why, they preemptive these political uncertainties by giving another doze of steroids to the market so that the impact of political stalemate does not ripple through the stock market, and consequently does not derail the nascent economic recovery.

As far as the political stalemate is concerned, this time it will be bad! On all previous occasions politicians started working on the debt-ceiling / government shutdown issues at least ~2 months in advance, with media shouting about this possibility ~3 months in advance. For example, in 2011 debt-ceiling was being discussed in the media in April/May time frame, months before the actual stock market decline in August.

But this time, it is different. Today, was the first time I saw something on the news about a potential government shut-down in a financial news outlet. This means that lawmakers are not taking this shut-down seriously with only 2 weeks left to the the shutdown. This will be followed by debt-ceiling debate, which needs to be settled in less than a month. And finally, since Republican lawmakers have been burnt by sequestration earlier this year, it is highly unlikely they will easily cooperate on this issue.

All of the above mentioned scenarios combined, suggest that there a lot of headwinds for the market in the near future. Under these circumstances, we will analyze the IPM model for trade timing  

Thursday, September 19, 2013

Fed Decision & Gov't Shutdown: Logic Behind Fed's Decision (Part 1)

So everyone was surprised by what Fed did yesterday. In fact, it is one of the times after a long time that I have seen so many people caught off-guard. Since I was expecting the market to go up after the announcement of the taper, I was not surprised by the rally after the announcement. I was surprised by the announcement to not taper. And to be sure, this surprise was equally shared between financial news media and economists. Since the surprise decision is now out, the question remains about the context of this decision.

In real world economists, Federal Reserve's officials, treasury analysts and central bankers typically make policy decisions based on fundamental analysis of macro-economic indicators. These indicators tell them how to manage their policy to control inflation, foster job growth and spur economic activity. Therefore, it will be very insightful to analyze the implication of federal reserve's recent decision of "not to taper" from a fundamental & socio-economic perspective.

For one, since everyone was expecting a taper decision. "Not Taper" turned out to be a perfect contrarion trade.

On the other hand, from a fundamental perspective the consensus was that Fed will start tapering its bond buying program in September 2013. And the reason behind this assumption was the language used by Fed's officials over the recent meetings was getting Hawkish. In these meeting's Fed's officials had started becoming "Hawkish" about the fiscal policy i.e. they were getting concerned about the potential increase in the inflation rate due to extremely accommodating monetary policy.

Behind the shift in Fed's language towards stricter monetary policy was recent economic data which was hinting towards robust economic growth in the US economy, along with significant gains in the housing market and stock indices. However, this data was available to the general public all over the world, and the data did not get worse over the last month or so.

Therefore, the question is: "What did the Federal Reserves' see differently during the September's FOMC meeting, which forced them to keep the extraordinarily accommodative monetary policy intact?"

This article will continue in next part ...