Twitter

Showing posts with label Fed Decision. Show all posts

Friday, August 25, 2017

Market at Crossroad & Potential Catalysts

Over the past few weeks, we are seeing several consolidation patterns popping-up in different markets. Consolidation usually signals in-decision or brief pause before resumption of the underlying trend. However, markets also consolidate in a sequence of 1s and 2s before a significant move in a new direction.

It appears like we are experiencing both the cases in different areas, where market is tracing out a sequence of 1s and 2s, and is waiting for a catalyst to break out of this consolidation. Following charts show this pattern:

Bonds: Since July Bond prices have been increasing but in an overlapping manner. This suggests that either this is a corrective move and we will see a move down soon, or we will soon see above June highs.


Gold: Over the past 4 days, Gold has placed in 4 inside days above the downtrend line and near the resistance. Inside days show indecision - a point where buyers and sellers are not comfortable making the move. Although most of sideways consolidations result in a move in the direction of the trends, next few days will be telling in terms of the move.


Stocks: SP500 is stair stepping down. Like other instruments, this stair-step pattern would either give way to a substantial decline in the near future or would turn out to be a correction in the broader up trend.

Even though stock market sentiment has come down recently, it remains elevated. On the other hand sentiment for Bonds and Gold is rising but not very optimistic yet. Proprietary timing indicators suggest that next turn date is few weeks away in the stock market. Therefore, if the market declines, other assets could rally but they need a catalyst to move away from current sideways indecision.

Need for Catalyst
Today's Jackson Hole speeches by Janet Yellen (Fed Chair) and Mario Draghi (Chair ECB) could be the catalyst that the market is waiting for.

If it is the trigger and if the markets start moving in 3rd wave out of this consolidation, logical move would be a rally in Gold and Bonds, while decline in Stock Market. Stock market is over-valued and has been rising for over a year, so this move is very possible. A decline in the stocks will be attributed to debt-ceiling debate and numerous other distractions from Washington by fundamental analysis but essentially it will be a natural part of the market rhythm.

We have underscored this observation multiple times that financial news media distracts investors. It can lead to early exit and pre-mature entry into investment positions. As a result, one of the lessons that we learned through 2016 is (Investing Lessons)

Lesson 1: There are no guarantees but being persistent is the key to long-term success

Long-term investing is regarded as the secret ingredient for many successful investors. Time is a very powerful commodity. If you give time to a successful business model or investing strategy, and combine it with dedicated and passionate management team, it will give you amazing long-term results.

Another reason why long-term returns are much more important than short-term returns is because when a portfolio achieve critical mass, one’s personal savings will not have that big an impact on the growth of portfolio. For example: $100K invested today will grow to 1M @ 20% return in ~13 years. At that point 100K will not have as much value because @20% / year an investor will experience a $200K increase without adding any more funds.

Thirdly, investing is a game of nerves and patience, whether in the stock market or any other endeavor like small business, start-ups through Angel/Venture investing, or Private Equity. The only difference with stock market based investing is that you have the opportunity to exit early because the market provides excessive liquidity, which provides peace of mind for many investors.

Long-term investment positioning and persistence provides investor with the focus needed to successfully withstand periods of draw-down because major moves take place after big draw-down periods. We will discuss additional lessons in the next post.

How to Position? 
Most of the readers would agree that the markets are at a critical juncture. However, knowing this is one thing and acting on this information is totally different. So far in 2017, we have mentioned several big moves on this blog and on twitter but doubt if effective trading was performed around this analysis by the readers.

Effective, long-term and consistent trading requires discipline and an edge in the market to adjust findings as market situations change. At this critical time, we are using proprietary models to expose clients to positions that have the highest success probability.  Performance - H1 2017 

Contact
  • Any investment / trading questions: Twitter (@survive_thrive)
  • Free e-mails or Investing: Click on the button below 

Friday, October 21, 2016

Stock Market Consolidation & Break-out Levels

Since July, market has been going sideways to down. This downdraft has been persistent, boring and choppy. While markets are still within 1-2% of all-time highs, this choppy action has brought forward a lot of bears and helped improve the valuation measures like P/E ratios. 

In fact, the true purpose of these kind of market declines/sideways corrections is to reduce optimism and lay the foundation for the next rally phase because investors get tired of the market performance.

Sentiment - Fear/Greed Indicator
CNN's fear greed indicator is suggesting that the frothy sentiment that we saw in mid July has now been replaced by lack of enthusiasm towards the market. 


In fact, the sentiment is as negative right now, as it was at the time of Brexit. Therefore, we can see another sharper rally from these levels.


Signs of a Break-out
While market's decline has been choppy in nature, it is along the top downtrend trend line. One key indication of a market trend reversal would be a break of the trend line to the upside. For DJIA, this trend line is currently at 18,300.  


A similar situation is present in case of SP500, where the downtrend line is crossing at 2166.


Therefore, a sustained rally of 100 points in DJIA and ~20 points in SP500 would confirm a break-out.

Overall, the markets remain in an uptrend. Market Classification Model remains in an uptrend. Therefore, there is a very high probability that we will soon experience a market break-out. Long lasting sideways action is preparing for a break-out after resetting optimistic sentiment, market valuations and technical indicators

If interested in free e-mail list or in paid services like Market Classification Model, IPM or others, please fill-out the form below.

Wednesday, October 19, 2016

The Next Big Opportunity - Emerging Markets

US Markets rallied impressively today. More importantly, they maintained the gains that were achieved at the start of the session. Hallmark of a sustained rally is that it continues and does not fail.

While US stocks are coming out of a consolidation phase (detailed analysis), and have many catalysts that could propel them to higher levels, the next big move might come from the emerging markets.

Long-term Emerging Market structure
Emerging markets have been in a sideways mode since 2011. For the past 5 years, emerging market have consolidated while US markets were making new highs. Following chart shows the performance of EEM (emerging markets ETF) over last 13 years.


Since 2003, emerging markets have gone through 4 phases:

  1. Major rally (impulsive move) lasting for several years and culminating in 2007
  2. Major correction of 2008, which was caused by global financial crisis
  3. Sharp rally out of the financial crisis lows of 2009
  4. Correction from 2011 highs that has brought EEM down to levels not seen 2006
Interestingly, both corrections (2 and 4) have a corrective formation i.e. 3-wave structure and both rallies (1 and 3) are impulsive in nature Therefore, it means that the trend remains up. And if the recent correction has ended, we should expect a very sharp and long-lasting rally in the emerging markets.

Short-term Structure
From a shorter term perspective, emerging markets are consolidating in a sideways formation. Once this sideways action ends and the market breaks out to the upside, it will have a lot of momentum. In fact, it could lead emerging markets to reach 2011 highs in the next burst higher.


Emerging market components
Although the EEM components will be adjusted next month, currently Chinese stocks determine the performance of the emerging market ETF. If Chinese markets are break-out, the entire emerging market complex will follow suite.

Market Classification Model
We have developed MCM for emerging markets. We will share the latest finding with subscribers. However, the bottom line is that the trend is approaching a reversal in the emerging markets to the upside. Once the trend reverses, we should expect a long-lasting rally in the emerging markets index.

Persistent investment behavior is critical for longer-term capital gains because that's the best way of gaining preferred tax treatment, which can significantly help your portfolio.

If interested in free e-mail list or in paid services, please fill-out the form below.


Thursday, September 22, 2016

Federal Reserves and Market Action

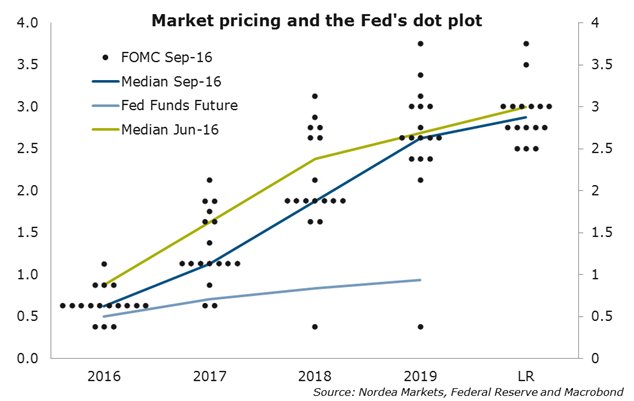
The Fed announced holding the rates and provided guidance for potential increases in future. It wasn't anything out of the ordinary. It was highly unlikely for the fed to raise rates at such time before the elections. However, the more interesting reading came from the dot-plot.

Fed uses this plot to provide guidance regarding future interest rate path. Median of the dots show a curve where Fed officials believe interest rates should be over the next few years.

Following chart shows the plot:


Along with the dot plot, above chart also shows the median projections for the next few years as taken in June and September. As one can see these estimates have come down a lot. As a result, the expectation of interest rise have also decline.

Once this expectation declines, it gives was to higher bond prices and lower yield. At this time, higher bond prices would mean more liquidity, thus being favorable for the overall asset class complex. This situation will surely change one day. For now, we are in an uptrend. In yesterday's analysis on Pre Fed and Bank of Japan announcement, we shared same outcomes

Market Classification Model has been bullish on Bonds for years now. And it seems like there is no reason to bail-out on bonds just yet. Even though many financial gurus have been predicting an inevitable bond demise, which will happen one day, current situation is supportive for a bond rally. As long as trend remains up, forecasts for bond collapse will not come to fruition. Therefore, it's imperative that one remains with the trend.

At Understand, Survive and Thrive, we use Market Classification Model to stay aligned with the trend. MCM is an algorithm based on some of the most time-tested market indicators and their inter-relations to determine when the trend changes, so that we don't stay on the wrong side of the trend for long.

If interested in free e-mail list or in paid services, please fill-out the form below.

Tuesday, September 20, 2016

Technology getting ready for a Break-Out

While the US markets have been going sideways, Nasdaq has traced out an inverted head and shoulders near all time highs (shown below):

These highs are 16 years old and there is vacuum above this level. If this pattern holds, we can expect a sharp rally in the near future. This rally can start in parallel with central banks announcements or it can start after a decline following Federal Reserves announcement. In any case, this is a very positive development for the market.

If Nasdaq can lead the market, we can be sure that the overall market will follow and that the recession talk will substantially subside. According to Market Classification Model, we remain in an uptrend. Uptrend typically results in rallies and market participants find reasons to be bullish even in front of negative news.

If interested in free e-mail list or in paid services, please fill-out the form below.


Pre-Federal Reserves and BoJ Analysis

Sideways Action Continues

This week, so far, has been as uneventful as prior week. Yesterday, markets opened higher but then sold-off towards the end to close slightly negative. Today, markets closed slightly positive. Since last Monday, market has gone net sideways without any major directional move.

Following chart shows that today we closed at the level where we close on Sept 9th, when the world was coming to an end and DJIA had just declined ~4%


Markets are like a coiled spring. And it seems like the entire world is waiting for the Central Banks. Bank of Japan is going to announce its policy statement early in the morning, while Fed announcement will come at 2 PM.


Bank of Japan and Yen

From Bank of Japan perspective, they would like Yen to decline because that was the catalyst to push Nikkei higher couple of years ago. Right now, Commitment Of Trader data (shown below) shows that the market is ripe for another decline in Yen, which means that its likely Japan will reduce interest rates further or introduce some sort of monetary stimulus.


If BoJ stimulates the market and forces a decline in Yen, we can expect a rally in the indices.


Technology getting ready for a Break-Out

While the US markets have been going sideways, Nasdaq has traced out an inverted head and shoulders near all time highs (shown below):

These highs are 16 years old and there is vacuum above this level. If this pattern holds, we can expect a sharp rally in the near future. This rally can start in parallel with central banks announcements or it can start after a decline following Federal Reserves announcement. In any case, this is a very positive development for the market.

If Nasdaq can lead the market, we can be sure that the overall market will follow and that the recession talk will substantially subside. According to Market Classification Model, we remain in an uptrend. Uptrend typically results in rallies and market participants find reasons to be bullish even in front of negative news.


Strategy Performance

Our proprietary model has been performing very well so far this year. Even with recent 2.5 month sideways consolidation, model is up 22.1% vs 6.3% rise in SP500. We will continue to monitor the performance of this model and share updates. This model will be available for investors to replicate or invest in towards the end of the year.


If interested in free e-mail list or in paid services, please fill-out the form below.


Wednesday, January 6, 2016

Long Term View of Dow Jones Industrial - $DJIA

Markets continued their decline and are again poised for a down day with China closing early due to circuit breakers being activated for the day.

We have been talking about the stock market trend change since September 2015 in the following blog posts:
  1. New Year and the Stock Market
  2. Bonds Rally Analysis and Stocks
  3. Importance of objectivity in trend following
  4. Current Market - Bear Case Evaluation
  5. Investment Optimization Model (IOM) Performance - August 2015

At the same time we have been discussing markets via twitter on a more frequent basis. In this post, I would like to analyze the market from a long-term perspective. Chart below shows the performance of Dow Jones Industrial Average over the past 2 decades. 


Following are the key highlights evident from the above chart:

  1. US stock market remained in a sideways phase for over a decade
  2. US stock market broke above the resistance level in 2012. This break was more pronounced in SP500
  3. Rounding top/Head and Shoulders top formations took place at the two prior tops. And currently, it seems like a similar pattern is being formed
  4. There is a longer-term trend line which the market failed to break to the upside, and might have capped this bull-market
  5. Since the economy lags the stock market by ~6 months, we can start seeing the impact of lower oil prices through energy sector decline in the economy, starting in Q3'16
  6. If the market has really topped, we can expect ~7+ months of decline to correct last ~7 years of rally (if we are not in a secular bear market)
  7. Decline in earnings will result in higher P/E ratio. As a result, stock prices might come down to bring the P/E ratio to normal or lower valuations
  8. Many of the individuals components of $DJIA are tracing out individual Head and Shoulder patterns, which could mean that the market's components are broken
  9. Best case scenario for this correction would be to end before breaching below 2011 lows
  10. Worst case scenario would be a break below 2009 lows and formation of an expanded traingle pattern, similar to 1970s bear market but a larger scale
In short, current market decline should be looked at with caution. Until and unless the model confirms a bull market, we will not enter long. Algorithm has been long bonds for a while and went short on stocks on Jan 1st. Aggressive portfolio is long other assets based on proprietary asset allocation mechanism.

At UST we have now dealt with short-term trading based on IPM trading model and longer-term investment based on Investment Optimization Model. We will continue to share our insights with readers. For now be careful. We will go long, as soon as the model goes long.


Monday, December 21, 2015

Bonds Rally Analysis and Stocks

Market's decline on Friday was very sharp and was on top of Thursday 250+ point decline in $DJIA. This decline has brought the market to a critical support level in Nasdaq and $DJIA, while in other indices like Russell 2000 and $SPY this critical level has already been broken to the downside.

Downside break means that the near term trend has turned down. Although some technical analysts might take this decline as a trend change signal, at UST we have been suggesting that a sea change has already taken place in the stock markets in August.

Unfortunately, many market participants are still not seeing the bigger picture because they don't follow objective trend analysis. Instead, they follow the market events and try to gauge the markets response to these events. At Understand, Survive and Thrive, we have always used objective market analysis and statistical models to identify market trends and turn points.

In the last post (link), we analyze the significance of recent Federal Reserves action and suggested that although the Federal Reserves thinks that the economy is strong and they can raise rates, this rate increase could not only have negative consequences on the market but also could result in lower rates. Longer term rates are governed by the perception of the economy of market participants and if investors don't believe in the same story of strong fundamentals, they might keep on buying the bonds, resulting in lower bond yields and higher prices.

Although this concept does not make intuitive sense, it was evident in the last few days where the market went down and interest rates also went down even after Fed's rate hike.

We have already discussed the potential fundamental issues with the economy and how its depends on the perception. There are also several technical reasons behind rally in bond prices:
  1. Inverted Head and Shoulders Pattern
  2. Capital outflow from bond funds
  3. Proprietary trend indicator
Current pattern in the bonds suggests that the longer term bonds, as depicted by $TLT below, are carving out an inverted head and shoulders pattern. As you know, inverted head and shoulders pattern is a bullish pattern and shows trend reversal from lower to higher. So it will be interesting to see how the market reacts over the next few weeks when this pattern matures and is about to break-out.


From socio-economic and sentiment perspectives, in anticipation of Fed's announcement many people jumped ship from the bonds and exited in great numbers. This could be interpreted as a potential contrarian buy signal for longer-term bonds.

Finally, as we have been saying for quite some time, bonds are in bull market for some time and will remain till model says otherwise. Therefore, we will find reasons for the bull market to continue which can be either due to economic weakness, technical rally or delay from Fed in raising rates further.

Please note that this analysis is only pertaining to high quality long-term bonds and not related to Junk bonds, which are linked to the economic activity. Weakness in economy would result in a decline in Junk bonds, as we have been witnessing over the past few months.

Wednesday, February 5, 2014

Markets Overview and Further Decline Possible

Yesterday's sideways action flows very nicely with the wave 4 argument. Wave 4s give way to wave 5. Therefore, we should expect another down draft in the very near future. Following chart shows the updated market structure.


In order for this structure to remain valid, market should stay below 1770. Once we break below recent lows and enter the 1730 area, we will near the end of Wave 3 of a higher degree. SP500 target levels is between 1722 and 1730.

This 5-wave completion could have two possibilities:

  1. Immediate sharp rally
  2. Immediate rally but more of a sideways market action, followed by another low
  • Scenario 1 would mean that markets will likely rally to new all-time highs.
  • Scenario 2 would mean that markets have entered a downtrend and one should be careful of rallies. 
From a Market Matrix perspective, it seems like market wants to decline to lower levels and this decline is not over yet. Sentiment is also not showing pessimistic extremes. Above all, one should wait for the IPM Turn Window to pick the bottom. Therefore, we will keep on analyzing the market for further clues and see how things evolve. This analysis will help us in next IPM Trade Matrix trade.

Please note that latest IPM Trade Matrix trades have been updated on the blog at: 

IPM Trade Matrix - Trade 4 (Part 3)


Monday, January 27, 2014

IPM Trade Matrix - Trade 2 (Part 3)

Market Overview
Recent market action has not only validated the accuracy of the Inflection Point Model (by the grace of God), it is also supporting the argument that the IPM Trade Matrix is a robust trading mechanism because it can adapt to different market conditions in advance (like it did recently). The goal of IPM Trade Matrix is to make trading a system with out emotions and generate consistent results. Consistency is the key to success in the world of investing.

By every passing day, market action gives the feeling that this correction could be a start of something big. Market has initiated the 8/4 Test. First step is almost complete with the test of 1770 level. Now the second step would be the Test. If the test fails and market break below critical levels, we will enter a downtrend. By the ways things are going right now, we might enter a downtrend in February. 

If market does enter the downtrend, we would have to switch to the Downtrend section in the IPM Trade Matrix. This would mean that we will enter one more trade by the next IPM Bottom window.  

For the time being, market's structure is nearing completion before rallying for few days. Near term structure looks very impulsive. Whereas, in SP500 it is missing only one more down move before the rally can start, wave structure looks complete for Nasdaq and Russell. 


It is possible that the rally might start on the Fed's news and might till the end of January. We will continuously evaluate the market structure to identify critical levels for counter-trend rally completion. But if January ends negative, there is a very high probability that it will be bad for the entire year. 


Trade 2 Complete 

TRADE - 1: Summary of Trade 1 (Long) = +2.6%

TRADE - 2: Summary of Trade 2 (Short) = +9.3%
Long TZA (short ETF) at 16.85 ==> Exit at 18.41 ==> +9.3%
Short positions were added on 1/23/14 and 1/24/14 based on IPM Top window expiration and subsequent break below critical level (Trade 1 - risk realized)

TRADE CONDITIONS
Condition: High within IPM turn window - Top. Next IPM window is a Bottom and is 3+ weeks away.  
Trigger: Decline below 1835 (SP500), below 16400 (DJIA) and below 2473 (Global Dow)
Supporting Indicators: Lack of proprietary momentum thrust in upwards direction, Influence of weekly IPM and High within IPM turn window
PROFIT TARGETS
Profit Target 1: 1770
Profit Target 2: 1724

Note: Exited all positions at Profit Target 1 because of Rule # 3: Exit all shorts at Target 1 if decline continuation signal is not present from proprietary momentum indicator and buy signals generated by key indicators. Moreover, Elliott Wave count is close to near-term completion. Re-evaluate situation in next 2-3 days to be ready for another short entry. 

RISK
Stop: Rally above SP500 = 1849, DJIA = 16498, Comp = 4246, Rut = 1181 (3 of 4)
Trailing Stops: SP500 = 1836, DJIA = 16310, GDOW = 2470 (Trailing stops will be updated next week - 1/31/14) 
Typical IPM Trade Matrix Risk: 1.5%
Actual IPM Trade Matrix Risk: N/A 

Risk Reason: No significant risk because upcoming turn date is a bottom.

Applicable Rule: If short with last IPM ~2 weeks ago & next IPM a bottom, review proprietary momentum indicator (combination of 5 indicators). If momentum = 1, stay till Profit 2, else exit all at profit 1 and re-enter later. 


Note: IPM Trade Matrix Trades will be posted in the first half of 2014. This is an experiment to understand and enhance the capabilities of this Matrix.

Tuesday, January 21, 2014

IPM Trade Matrix - Trade 1 (Part 6)

Market Overview:
Market has been going sideways. This kind of market action suggests that the market is getting ready for a blast higher. There is no significant hindrance which can stop the market from rallying. Although market driving news typically comes from the left field, market structure is suggesting smooth sailings for the next 2-3 weeks. Details about the next market turn date has been e-mailed to subscribers. Overall, it seems like market wants to give Chairman Bernanke a standing ovation before his departure from the Fed towards the end of this month.

As per Elliott Wave structural analysis, market is setting up for a sharp rally (wave 3 of a minor degree) - possibly into the early February.


As far as the IPM Trade Matrix trading is concerned, we are still tracking this trade below and will continue to do so till we exit the trade.


First Trade of 2014 is in process:

SP500 (1/16/14) = 1844
DJIA (1/16/14) = 16414

TRADE
Long TNA at 76.25 (original) ==> 76.6 (new)
Long FAS at 92.30 (original) ==> 91.6 (new)
Long TSLA at 171.2
Long positions were added on 1/14/14 & 1/16/14 based on IPM Bottom window expiration and low risk scenario

Condition: Next IPM Window is Top or Bottom
No. of Trades between turn windows: 1
Triggered (Updated at End of Day on 1/9/14): Rally above 1837 (SP500) and above 16450 (DJIA)
Profit Target: 1885-1890 (Will be evaluated as Elliott Wave structure matures)

RISK
Stop: Below SP500 = 1816, DJIA = 16217, Comp = 4090, Rut = 1141 (3 of 4)
Trailing Stops (updated on 1/15): Close Below SP500 = 1835, DJIA = 16442, Comp = 4170, Rut = 1160 (3 of 4) 
Typical IPM Trade Matrix Risk: 1.5%
Actual IPM Trade Matrix Risk (1/15/14): 0% (Entry = 1837, Exit = 1835, Risk = 0%)
Risk Reason: IPM Top is approaching. Market needs to hold during this top window, otherwise we can see a serious correction. Rise above 1850 will neutralize this risk

Applicable Rule: If next minor IPM turn window is within 2 weeks then wait for a confirmation break before exiting longs. 

Note: IPM Trade Matrix Trades will be posted in the first half of 2014. This is an experiment to understand and enhance the capabilities of this Matrix.


Friday, September 20, 2013

Fed Decision & Gov't Shutdown: This Time Its Real (Part 2)

Part 1

This question suggests that either Fed does not think the economy is strong enough right now, which means there is some thing fundamentally wrong. Or they are anticipating a major shock in the near future. This leads us towards the upcoming budget discussion and possible government shut-down starting on October 1, 2013.

I think Federal Reserves' was looking ahead and they saw a real policy of a government shutdown in October, along with another long-drawn battle on debt-limit increase. That is why, they preemptive these political uncertainties by giving another doze of steroids to the market so that the impact of political stalemate does not ripple through the stock market, and consequently does not derail the nascent economic recovery.

As far as the political stalemate is concerned, this time it will be bad! On all previous occasions politicians started working on the debt-ceiling / government shutdown issues at least ~2 months in advance, with media shouting about this possibility ~3 months in advance. For example, in 2011 debt-ceiling was being discussed in the media in April/May time frame, months before the actual stock market decline in August.

But this time, it is different. Today, was the first time I saw something on the news about a potential government shut-down in a financial news outlet. This means that lawmakers are not taking this shut-down seriously with only 2 weeks left to the the shutdown. This will be followed by debt-ceiling debate, which needs to be settled in less than a month. And finally, since Republican lawmakers have been burnt by sequestration earlier this year, it is highly unlikely they will easily cooperate on this issue.

All of the above mentioned scenarios combined, suggest that there a lot of headwinds for the market in the near future. Under these circumstances, we will analyze the IPM model for trade timing  

Thursday, September 19, 2013

Fed Decision & Gov't Shutdown: Logic Behind Fed's Decision (Part 1)

So everyone was surprised by what Fed did yesterday. In fact, it is one of the times after a long time that I have seen so many people caught off-guard. Since I was expecting the market to go up after the announcement of the taper, I was not surprised by the rally after the announcement. I was surprised by the announcement to not taper. And to be sure, this surprise was equally shared between financial news media and economists. Since the surprise decision is now out, the question remains about the context of this decision.

In real world economists, Federal Reserve's officials, treasury analysts and central bankers typically make policy decisions based on fundamental analysis of macro-economic indicators. These indicators tell them how to manage their policy to control inflation, foster job growth and spur economic activity. Therefore, it will be very insightful to analyze the implication of federal reserve's recent decision of "not to taper" from a fundamental & socio-economic perspective.

For one, since everyone was expecting a taper decision. "Not Taper" turned out to be a perfect contrarion trade.

On the other hand, from a fundamental perspective the consensus was that Fed will start tapering its bond buying program in September 2013. And the reason behind this assumption was the language used by Fed's officials over the recent meetings was getting Hawkish. In these meeting's Fed's officials had started becoming "Hawkish" about the fiscal policy i.e. they were getting concerned about the potential increase in the inflation rate due to extremely accommodating monetary policy.

Behind the shift in Fed's language towards stricter monetary policy was recent economic data which was hinting towards robust economic growth in the US economy, along with significant gains in the housing market and stock indices. However, this data was available to the general public all over the world, and the data did not get worse over the last month or so.

Therefore, the question is: "What did the Federal Reserves' see differently during the September's FOMC meeting, which forced them to keep the extraordinarily accommodative monetary policy intact?"

This article will continue in next part ...