Twitter

Showing posts with label Unemployment Report. Show all posts

Saturday, February 4, 2017

January 2017 - Performance Review

January was an interesting month for the markets. In the beginning of the month, markets continued to go sideways, which they had been doing for past couple of weeks - since mid December 2016. Then came the earnings and market zoomed higher. Although this rally was not as significant as post election rally in 2016, it did bring back a lot of enthusiasm. The rally continued with President's oath taking. However, it experienced some difficulty towards the end, with the immigration executive order confusion and protests across the United States.

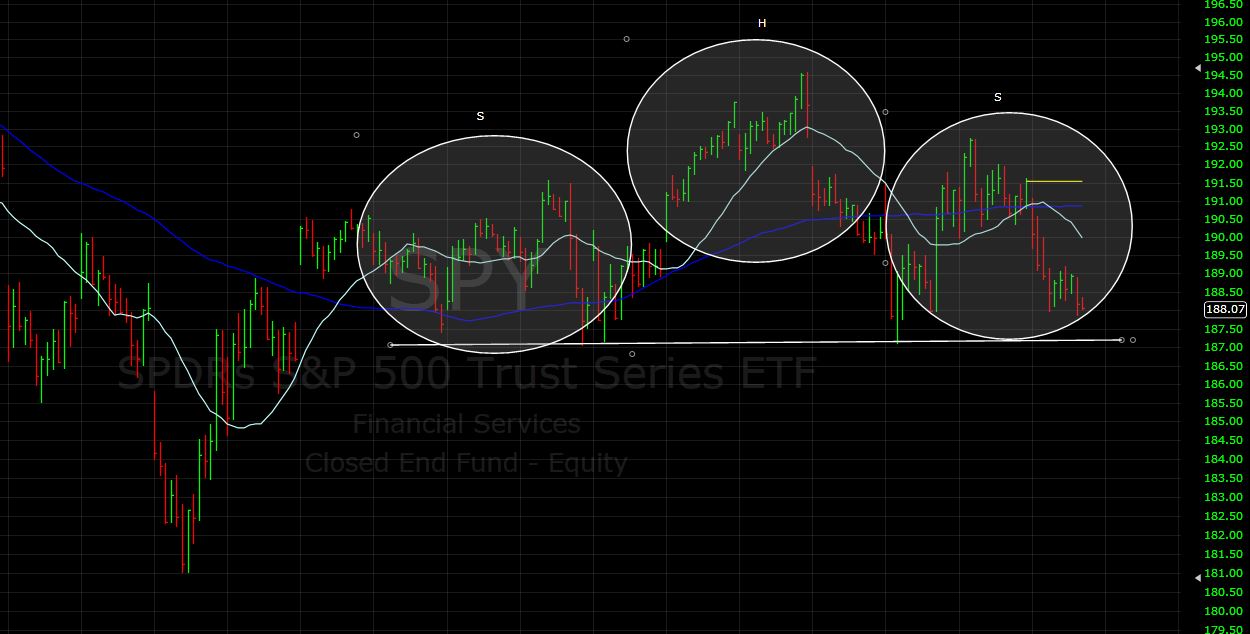
Following chart shows how SP500 performed in the first month of 2017:


To summarize January action, it was a volatile month. Volatility does not only impact our portfolio, it hampers our investment decisions, self-confidence and risk-taking abilities. In order to reduce the impact of volatility and realize long-term consistent results, UST team develop proprietary strategies based on our 8+ years of investing experience, as documented in this blog and other sources.

These strategies went live with real money at the start of 2016. Their 2016 performance has been documented here (link). Our team is currently working on more than 5 strategies. Two of these strategies have moved to production, two are in beta phase and others are in final development phases.  

Investment Strategies

Two strategies (one conservative and other aggressive) will be used for clients' investment needs. These strategies are customized to meet the performance and risk profile needs of investors. These strategies utilized strategic and tactical portfolio allocation techniques, along with proprietary market timing methods to generate Alpha with extremely low correlation with the benchmark SP500. Hence, have very high Sharpe Ratios.

Following chart shows January 2017 performance of Conservative and Aggressive strategies, directly taken from the brokerage account.

Conservative strategy performed 4.53% and Aggressive strategy gained 11.36%, while SP500 was up 1.90% in January.

Performance of these strategies is also tracked on OpenFolio to see daily changes. Following chart shows daily YTD performance for the Conservative Strategy:


Interested ? 

There are two ways to follow and invest in the strategy:
  1. Utilize some of the offerings that UST offers (link). We will officially start sending our Market Classification Model updates in February 2017. And plan to add additional services in the next few months.
Overall, we will actively be working on this blog to ensure that all the services are streamlined. If you have any questions please feel free to comment or interact with the team via Twitter @survive_thrive. Please use the below sign-up button to register for free newsletter or other services:


Tuesday, January 31, 2017

US Stocks at Tipping Point

For readers who want to quickly read about the action plan in this environment, scroll down to the Next Steps section. For detailed understanding of current situation, please read through:

Background

Latest rally phase started in November 2016, around election time. Initially, it was regarded as a relief rally for Hillary could become president as FBI investigation had yielded no results. However, it quickly turned into Trump rally because of promises for stimulus and other pro-business policies.

The popular belief was that the new president will only implement pro-business policies like stimulus and tax cuts, while several other more aggressive policies will not be enacted. Fast forward to today, and the pro-business policies remain elusive while the aggressive policies are causing confusion and in return global equity markets are suffering.

Correction that was due

Blaming the market's decline on policies or some external factors is what TV commentators do. But there is another perspective to looking at this decline. And that is related to the fact that the markets have not experienced any substantial decline since last February (2016).

Following charts shows a nicely persistent rally that had endured over the last year in the face of all the uncertainty of 2016. Both SP500 and Nasdaq show a clear 5-wave rally pattern.


It is surreal to look back at the extremely dismal start of 2016, when people were talking about Oil crash and so many other variables. Even then the market managed to end up ~12% in 2016.

In such a volatile year, our proprietary strategy beat the market and the gained 12.2%. Most of the gains were long-term gains, thus minimizing tax impact (Detailed 2016 performance evaluation).

Therefore, one cannot judge the performance of the market just by looking at couple of months. But one thing is for sure, volatility will be high as overdue correction finally arrives.

No Buy signal, means continued decline

There are several other reasons to believe that recent decline is the start of something bigger:
  1. No buy signal after 2 day decline
  2. Extremely high valuations
  3. Political uncertainty without any focus on economic stimulus programs
  4. Hawkish Fed 
  5. Fairly optimistic sentiment
In order for these stock market rally impediments to go away, market needs to consolidate recent gains. Right now there is no indication that this decline will be the start of a new bear market. However, if the government does not deliver on its pro-business policies, it could quickly turn into one.

Next Steps and Investing Strategies

  1. Keep an eye on the Market Classification Model to understand if and when the stock market enters a Bear Market (MCM Details).
  2. US markets are still in Bull phase and this could be a good buying opportunity, at lower levels
  3. Gold and Bonds can be good alternatives, with careful review of the MCM
  4. Develop an investment plan with your goals in mind and invest accordingly. For example, if you want good returns and have some extra cash, one can buy BitCoins
We will continue to explore 2017 strategic investing ideas on this blog. Forward looking investing helps you in keeping a level head while investing. For example, we mentioned that the market had not entered a bear market in Oct-Nov 2016 and added longs, and ended up benefitting from the latest rally. Analysis during election time:
Therefore, if your interested in free e-mail list or in paid services like Market Classification Model, please fill-out the form below.

Monday, January 30, 2017

Amazing 2016 for UST Proprietary Strategy!!

Happy New Year to all the readers. 2016 was an amazing year with our conservative strategy up 12.2% versus 11.96% of SP500 (with dividend). Snapshot below is taken from the brokerage account.


Introduction

We will start 2017 by reviewing 2016 performance. This review will cover every aspect of the performance, along with how the strategy performed in times of uncertainty and volatility. Each blog post will cover a different aspect of the performance review.

UST team has been developing repeatable, scalable and easily explainable proprietary investment strategies, along with built-in risk-management measures. In 2015, the strategy was developed and back tested. Last year, strategy was moved to production with real money. At the same time, we also developed 3 additional strategies, which will be discussed in future posts.

2016 - The Year of Volatility:

2016 was a very volatile year. It started with one of the worst starts of the year for the US stocks. Although market started a rally phase from Feb/March time frame, it remained on the edge due to following three major reasons:

  1. US presidential election primaries
  2. Fed's rate decision
  3. Brexit 
Brexit was one of the biggest surprises of 2016. The night of Brexit vote, market dropped over 1000 points before starting another rally phase, which most of the market participants didn't see. This was followed by an unprecedented US presidential election, which took almost everyone by surprise. If some people got the election results right, their market positioning was wrong. In the end market ended with a ~12% gain from a ~5% loss at the start of the year.

Conservative Strategy Performance - 2016

Interesting aspect of this strategy is that the returns are uncorrelated with the market. 2016 Beta was -0.57, while 9 year back-testing showed a Beta of -0.08. Since the returns are totally independent of the market performance, we can say that these returns were Alpha.

Throughout this volatile year, our proprietary model kept us on the right side of the trade and kept on adjusting the holdings to dampen impact of volatility, while amplifying potential gains. Following is a snapshot from the brokerage account showing the monthly performance:

Following chart is from Openfolio, showing daily change of the same portfolio in 2016:

Overall gains were impacted by pre-election jitters and post-election bond rout. However, it gave the strategy an excellent buying opportunity, whose benefits we could reap in 2017. We also learned several very important lessons for the strategy, which has enabled us to improve the nimbleness of the model. Benefits of these additions are clearly visible in 2017's performance, which we will discuss in one of the next blog posts. 

Investment Options

We are working very hard to make these strategies available for investors. If you are interested in investing, you can register below and we will send you update when the strategy is available for investments. Some of the key outputs from the data models used in this strategy are also available through subscription

Tuesday, December 6, 2016

November Review and December Forecast

Over the last 2 weeks we have discussed Gold market and the Bond market, in terms of their structure and sentiment, to understand the next rally phase. Detailed analysis can be reviewed here:
As we enter a new month, its critical to quickly review last month and then try to understand where things could go in the last month of 2016.

November 2016

Elections 
At the beginning of November, market experienced a sustained consecutive negative days. This negative behavior, not only tilted the sentiment to bearish and technical indicators to oversold, it also completed the correction pattern. This completion gave way to an amazing rally. We discussed the upcoming rally several times in following posts:
even though few people will remember this fact but the market started rallying even before the election on the news that FBI had dropped the investigation involving Hillary Clinton's e-mail. At that point, people attributed the rally to Mrs. Clinton's impending victory. However, as Mr. Trump won and the market continued its rally, it took many by surprise. 


This tells us that news/economic/political events don't matter. It's the reaction to these events that matter. And one of the best ways to gauge the reaction objectively is by looking at the price structure and sentiment indicators, along with forecasting strategies. 

Correlation with the US Dollar
Even more interesting is the fact that this rally has come in sync with rallying US Dollar. Typically, when US Dollar rallies, all asset classes are impacted. And if not directly impacted, they find it difficult to rally. But following chart shows the amazing correlation between US Dollar and the stock market:


Divergence with Advance Decline line
While this rally has made a lot of market commentators excited about the prospects of a major rally and 2017 with prospects of a major stimulus, this rally wasn't substantial enough to eliminate NYAD divergence.

Divergence in Advance Decline issues is critical for a sustained rally. This doesn't mean that this current rally cannot move much higher, it just means that the near-term rally could face challenges to continue in face of this divergence.

What's Next in December?

In summary, we have credible reasons to believe that the recent stock market rally is extended and we could see a market correction over the next 1-2 weeks (probably till next IPM turn window). While Stocks market corrects, asset reallocation can take place with money flowing into oversold sectors like Gold and Bonds.

Since US Dollar is also extended, a correction in the Dollar index will also support Gold rally. On the other hand, Fed FOMC meeting and an announcement to increase the short-term rates can also reduce some of the uncertainty from the Bond market, which could result in reprieve rally for Bonds.

Market might resume its uptrend in the 2nd half of December. However, the velocity of the ascent might not be as significant, as it has been in November.

Lastly, for Gold it is a do-or-die point. It needs to rally above 1205 in the next few weeks or it will likely enter another bear market.

If interested in free e-mail list or in paid services, please fill-out the form below.


Thursday, November 10, 2016

Post Election Investment World

We have been discussing stock market uptrend and upcoming bottom for the past few weeks (post 1, post 2, post 3). And as of today, DJIA futures are above all time highs (shown below).


Such a market action in the face of presidential uncertainty is amazing. Although it bodes very well for the overall economy, we will talk about potential Trump impact in the upcoming post.

From an investment perspective there are different scenarios that one needs to be aware of.

Stock Market:
As stocks break out into uncharted territory and Nasdaq approaches the vacuum zone, it means that we are on the cusp of a major rally.


Like many rallies before it, this rally will also be debated by market participants as to why would market rally while president's economic plan would mean job losses. However, the pattern suggests that the stock market remains in a bull trend.

In essence, the underlying economy is very strong and would result in strong growth without any external influence. We will discuss internal structure of the market in future posts.

Bond Market:
Bond market's sharp sell-off probably suggests that the long-term bond bull market has ended. We are probably on the cusp of a significant inflation cycle. Near zero bonds are a thing of the past. Even though we might see some respite from the Federal Reserves, which might hold-off on the decision to increase the interest rates, we are surely in for higher rates.

Following chart shows a very long-term bond yields. Post-election rally has broken a long-term down trend line - another confirmation of the trend change. We have been keeping track of this wave count for years now and have discussed potential bond yield bottom with clients.

Many of our clients bought houses, properties etc in the last 2 years!


This market behavior has significant consequences for investors and we will discuss these consequences in detail. However, one should keep in mind that this kind of behavior will not result in bonds going to stratosphere in the near future. In fact, after couple more months of rising yields, yields might see a very sharp correction.

Metals
Copper has rallied very sharply over the past few days. Precious metals rallied on the news of potential Trump win - fear trade, but since then have declined. This decline was a significant intra-day reversal. But the overall trend in metals remains up.

Gold could continue to rally in anticipation of a higher inflationary environment. So will the gold stocks. Gold and Silver are tracing out very interesting patterns and could have significant upside potential if the can break above 1320 in Gold. We will also discuss the gold pattern in the near future. Past analysis on gold accurately predicted the bottom in October.

Portfolio Allocation:
Our proprietary model has performed extremely well in 2016. It not only kept us in the market during relevant bull phases, it also enabled us to maintain our calm whether during Brexit shock or Trump shocker. Any portfolio that can:

  1. Yield returns which are uncorrelated to the market
  2. Save a lot of heart-burn when the market goes against you by 1000s of points whether in futures or cash
  3. Provide you consistent returns AND
  4. Mitigate volatility and provides very high Sharp ratio
by the grace of Almighty, is an amazing performance. We will write a white paper on the performance of the model portfolio in 2016 - a year of surprises and nerve wrecking market action!

If interested in free e-mail list or in paid services, please fill-out the form below.


Tuesday, November 8, 2016

Reasons to be Bullish - From Twitter

Elections and the Stock Market

Market rallied very powerfully today and after a long time it sustained the morning gains. Not only did it sustain the morning gains, market was able to build on it.

We have maintained that the stock market remains in an uptrend and no matter how the election results come out, market would continue its uptrend till the time it enters a bear market. Right now there are no indications that the trend has reversed.

In fact, right now, market seems to have completed its ~4 month long sideways action and is on the verge of breaking out of current 2 year old range.

We discussed the market structure in this post few days ago. Following charts shows what was highlighted and what we saw today:


Long-term consolidation along with this pattern and sentiment decline suggests that there is a very good chance we could see a sharp rally from here. This rally could last for few months. Following chart shows the longer-term range bound market:

Portfolio Alignment
Our strategies are aligned with this potential market moving scenario is ready to take advantage of market move. At the same time, it is possible that we might see a surprise in the election and could witness some near-term turbulence in the markets. Keeping this scenario in mind, we are positioned to mitigate any volatility impact. 

Our portfolios take advantage of market moving events by positioning ahead of them and hedging against potential risks. So far in 2016, we are up ~20% YTD with a Beta of 0.36 i.e. these returns are totally uncorrelated with stock market performance.

As for other areas for investment, we will discuss metal and bonds in the next few posts. Bonds might see further sell-off after the election and before Federal Reserves rate announcement in December. 

If interested in free e-mail list or in paid services, please fill-out the form below.

Friday, November 4, 2016

Market Approaches Key Levels

Market's decline is now almost 3 months old and sideways action is ~4 months long. In the beginning this action was purely sideways but recently, it has taken a sharper turn to the downside. With this decline comes an opportunity that the sentiment is getting worse by the day, while proprietary indicator remains in a bull state.

This worsening sentiment is essentially fuel for the market. Sentiment is one fuel which really kindles market rallies. Right now sentiment is at level normally seen at significant market bottoms, and the market structure is now supporting a potentially sharp rally.

Market Structure
Recent investigation of the market structure suggests that the SP500 along with other indices is tracing out a potentially corrective structure of 3 wave decline.

Following chart shows this structure. Wave C (3rd leg) seems like an ending diagonal. Ending diagonals take place towards the end of a market move and give way to a sharp rally. So once the market rallying, it could take-out many of the recent highs.


Similar pattern is visible in almost all major indices. Following chart highlights this structure in Dow Jones Industrial Average


Along side this market structure, stock market indices have also traced more than 50% of their rally since Brexit vote. This shows that recent correct is now very substantial and should be treated as a minor wave 2. If this is wave 2, it will give wave to a very sharp wave-3 rally.


Sentiment

Following charts show sentiment as measured through Fear/Greed indicators and AAII. Both of these measures suggest that the sentiment is in areas where we see significant bottoms.


However, the key is to be detached with the market. Know when there is potential for market moving events but stock to your plan. So far in 2016, our strategic investment portfolio has beaten the stock market by ~12%.

 If interested in free e-mail list or in paid services, please fill-out the form below.

Monday, February 8, 2016

Employment Numbers, Economy and Market

Economy continues to perform below expectations. Latest job numbers were OK but not GREAT. I don't think they are even good enough to justify future rate hikes. But unfortunately Federal Reserves is locked into this situation where they have already committed several rate hikes for 2016. Although they won't do four hikes in 2016, any hikes will result in a flattening yield curve and possibly lead to negative yield curve.

Yield curve inversion typically leads to a recession. Although the numbers are not showing eminent recession right now, the stock market is now surely discounting a significant slowdown in economic activity. If the economy is to enter a recession, we could see further losses in the market.

From a socioeconomic perspective, a recession/bear market in the final year of election, could pave the path for a socialist president in the form of Bernie Sanders because people will be angry towards capitalists.

Getting back to economy, industrial activity has slowed considerably, which is an indication that the manufacturing sector is already in a recession. Number of job cuts being announced reminds us of the days of the great recession, when the news was always about reduction in workforce. When you have job-cuts coupled with tightening Fed policy, restricting the money flow, it just exacerbates the economic situations.

In fact, it leads the economy into a death spiral where one negative news feeds the other negative thing and so the cycle continues. For example, reduction in jobs will result in lower spending, which will in turn reduce profits, resulting in lower stock prices and cost-cutting measures, which will result in more job-cuts.

Under these circumstances, stock market is tracing out a series of mini-head and shoulders patterns. As you know head and shoulders pattern are topping formation. These patterns also appear in a downtrend as continuation patterns. Following chart shows H&S pattern in SP500.


If market declines in the next few days, this pattern will be broken and January lows will be tested. This will allow the market to complete the right shoulder of a longer-term head and shoulders pattern (discussed here)

Under these circumstances, the best option is to stay out of the market and wait for a trend change before going long again. Bonds remain in a bull market, so they can be a good place to park cash and ride-out this rough patch in the stocks, which could last for the next few quarters (at least).

Tuesday, February 2, 2016

Downtrend Continues

Market resumed its decline in a major way today. More interesting than the decline was the muted reaction from the traders, as VIX did not spike. If fear doesn't spike with declines, it means that we have further decline ahead.

Market rallied last week but got way over-bought in just few days. In fact, a sell signal was generated on Friday. That sell signal resulted in decline yesterday from which the market initially recovered. However, it was too much weight for the market to carry. As a result, it gave way to serious selling today.

We have been maintaining that the stock market's inherent structure changed last year in August, and suggested a move to cash. Proprietary portfolio allocation model allowed us to diversify between bonds and short stocks. This portfolio has been performing very well so far this year (link). It is up +6.7% this year, while SP500 is down 6.7% this year. We will talk about latest results in the next post. Right mow, let's look at the structure of the market.

Nasdaq along with many other indices, is tracing out another head and shoulders pattern. This pattern is larger in magnitude than the prior pattern, and could result in substantial decline.


Over the next few days, market will fill the right shoulder of this pattern. Once right shoulder is filled and market breaks below the neck-line, significant decline can be in the offering.

Head and Shoulders are reversal patterns, and when you see a cluster of these patterns, as shown above, they become even more important. Overall, it means that the trend of the last 7 years has ended and we have entered a bear market. This would mean that the economy will slow down and we might see additional bad news coming from different market segments. Oil was the initial catalyst but now we could see other areas hurting.

However, many people are just realizing this new development and others are still oblivious to a market decline. But we prepared for this potential scenario and now are waiting for the downtrend to unfold over the next few months. Bonds remain in a bull market, as yields continue to decline.


Wednesday, January 6, 2016

Long Term View of Dow Jones Industrial - $DJIA

Markets continued their decline and are again poised for a down day with China closing early due to circuit breakers being activated for the day.

We have been talking about the stock market trend change since September 2015 in the following blog posts:
  1. New Year and the Stock Market
  2. Bonds Rally Analysis and Stocks
  3. Importance of objectivity in trend following
  4. Current Market - Bear Case Evaluation
  5. Investment Optimization Model (IOM) Performance - August 2015

At the same time we have been discussing markets via twitter on a more frequent basis. In this post, I would like to analyze the market from a long-term perspective. Chart below shows the performance of Dow Jones Industrial Average over the past 2 decades. 


Following are the key highlights evident from the above chart:

  1. US stock market remained in a sideways phase for over a decade
  2. US stock market broke above the resistance level in 2012. This break was more pronounced in SP500
  3. Rounding top/Head and Shoulders top formations took place at the two prior tops. And currently, it seems like a similar pattern is being formed
  4. There is a longer-term trend line which the market failed to break to the upside, and might have capped this bull-market
  5. Since the economy lags the stock market by ~6 months, we can start seeing the impact of lower oil prices through energy sector decline in the economy, starting in Q3'16
  6. If the market has really topped, we can expect ~7+ months of decline to correct last ~7 years of rally (if we are not in a secular bear market)
  7. Decline in earnings will result in higher P/E ratio. As a result, stock prices might come down to bring the P/E ratio to normal or lower valuations
  8. Many of the individuals components of $DJIA are tracing out individual Head and Shoulder patterns, which could mean that the market's components are broken
  9. Best case scenario for this correction would be to end before breaching below 2011 lows
  10. Worst case scenario would be a break below 2009 lows and formation of an expanded traingle pattern, similar to 1970s bear market but a larger scale
In short, current market decline should be looked at with caution. Until and unless the model confirms a bull market, we will not enter long. Algorithm has been long bonds for a while and went short on stocks on Jan 1st. Aggressive portfolio is long other assets based on proprietary asset allocation mechanism.

At UST we have now dealt with short-term trading based on IPM trading model and longer-term investment based on Investment Optimization Model. We will continue to share our insights with readers. For now be careful. We will go long, as soon as the model goes long.


Thursday, February 13, 2014

IPM Trade Matrix Update - Trade 5 (Part 2)

Markets corrected yesterday (going sideways) and are correcting this morning. This is what we have been expecting - a minor pullback, to setup further rally. If this pull-back continues till the last day of the IPM turn window, IPM Trade Matrix will go leverage long because the risk will be minimized. 

However, at this point, it seems like the market will continue higher and a deeper pull-back will ensue from a higher price level. As along as market can stay above Feb 5 lows, we are in good shape and will most likely see all-time highs.

At the same time, there are certain risks roaming the market and can derail this rally:
  1. Debt ceiling issue, which needs to be resolved by Feb 27th (Good progress has been made on the resolution)
  2. 1929 analog chart. If true, this chart would mean that the markets are headed for a crash like situation
  3. Tapering of the QE. It remains to be seen how will the market react to future tapers.
While on one hand these issues are a source of concern, they have also strengthened the Wall of Worry which Bull markets likes to climb. Therefore, it will be interesting to see how things unfold in the near future. As always, UST's trade decisions will be based on a totally objective IPM Trade Matrix, so that our judgement is not biased by market conditions.   


IPM Trade Matrix 2014 Trades

TRADE - 1: (Long) = +2.6%
TRADE - 2: (Short) = +9.3%
TRADE - 3: (Long) - Non IPM Trade Matrix trade -0.2%
TRADE - 4: (Short - 1/31/14 to 2/5/14) +7.25% 

TRADE - 5: Long
Long TNA at 70  
Longs were initiated on 2/11/14 based on IPM Trade Matrix Trigger and Elliott Wave structure 

TRADE CONDITIONS
Condition: Bottom within IPM Turn Window 
Trigger: Rally above SP500 = 1789, DJIA = 15790, Russell 2000 = 111.5, Global Dow = 2401
Supporting Indicators: Up trend (8/4 Test has not been completed), Next IPM can be either Top/Bottom

PROFIT TARGETS
Profit Target 1: 1870
Profit Target 2: 1930

RISK
Stop: Break below 1750
Trailing Stops: Will be identified in 1 week
Typical IPM Trade Matrix Risk: 1.5%
Actual IPM Trade Matrix Risk: 3.5% (Entry = 1813 , Exit = 1750 , Risk = 3.5% )
Risk Reason: There are multiple reasons to be worried: 1929 stock market parallel, 8/4 Test to the downside is in process, and major IPM Bottom window is in process.  

Applicable Rule (There are 7 Rules in the IPM Trade Matrix. Following are applicable to the market right now): 
  1. Do not go long or short without trigger to prevent losses by market moving against you.  
  2. Exit half at profit objective 1. Exit full at profit objective 1 if proprietary continuation signals are not present.
  3. Observe stop-losses to minimize draw-downs

Note: IPM Trade Matrix Trades will be posted in the first half of 2014. This is an experiment to understand and enhance the capabilities of this Matrix.


For Blog updates on Google+ add: Understand Survive Thrive 
For Blog updates on Twitter, add: @survive_thrive

Monday, February 10, 2014

Market Analysis and Upcoming IPM Trade Matrix Trade

Market has started consolidating its gains that it made last week. This consolidation can be a sideways affair or can result in a deeper decline. There are many market moving events coming up in the near future that could result in a market decline. Tomorrow Ms. Janet Yellen will speak to the Congress. Any of her mis-timed comments can result in a market decline.

This is a strange situation for the new Federal Reserve's Chairwoman.On one hand, she might want to justify the tapering of stimulus but on the other hand, she would also want to add that the Fed is ready to act with more stimulus. Therefore, markets can behave strangely tomorrow and on Thursday because she will again testify on Thursday.

Overall, market structure is ripe for a pull back. Market rallied sharply over the last week (as seen below) and needs to absorb these gains. From an Elliott Wave perspective, this could come in 2 different forms:

  1. Sideways & choppy market action for the next few days till market bottoms
  2. Sharp decline. This decline could either make new lows or result in a higher low

From an Elliott Wave perspective, market's higher low will be treated as the 2nd wave. This will be followed by a sharp rally, possibly to all time highs. Last time we saw a higher low during an IPM turn window was in February 2010. This low gave way to a ~2 month rally. We will continuously evaluate the market structure and trade base on IPM Trade Matrix.

Reason for not going long already is that one of IPM Trade Matrix's rule states that one should only trade after the trigger. Trade has not been triggered yet. Therefore, we are on the sidelines to prevent losses by market moving against us. Capital preservation is much more important than some gains without following the system.


IPM Trade Matrix 2014 Trades

TRADE - 1: (Long) = +2.6%
TRADE - 2: (Short) = +9.3%
TRADE - 3: (Long) - Non IPM Trade Matrix trade -0.2%
TRADE - 4: (Short - 1/31/14 to 2/5/14) +7.25% 

TRADE - 5: Long

TRADE CONDITIONS
Condition: Bottom within IPM Turn Window - Date info e-mailed to subscribers
Trigger: Rally above critical levels after a decline. Level will be outlined within next few days
Supporting Indicators: Up trend OR Absence of decline intensity + Next IPM Turn window is 3+ weeks away

PROFIT TARGETS
Profit Target 1: Will be determined after the entry
Profit Target 2: - 

RISK
Stop: After trade is triggered
Trailing Stops: - 
Typical IPM Trade Matrix Risk: 1.5%
Actual IPM Trade Matrix Risk: N/A (Entry = - , Exit = - , Risk = - )
Risk Reason: -

Applicable Rule: 
  1. Do not go long or short without trigger to prevent losses by market moving against you.  
  2. Exit half at profit objective 1. Exit full based on IPM Trade Matrix Rule #3

Note: IPM Trade Matrix Trades will be posted in the first half of 2014. This is an experiment to understand and enhance the capabilities of this Matrix.


For Blog updates on Google+ add: Understand Survive Thrive 
For Blog updates on Twitter, add: @survive_thrive

Saturday, February 8, 2014

Jobs Report and Market's ~200 Point Rally

While job report was not very good, markets rallied none the less (as mentioned in the last update). As a result of this rally, many bulls who had just turned bears near the bottom and were expecting a bigger correction, are now reverting to their bullish stance. This is the danger of investing blindly in the market without knowing the real drivers of the market.

Although fundamentals do drive the market to a certain extent, only price pays. Therefore, one should keep a close eye on the price before making an investment decision. 

At this point, with yesterday's sharp rally, price is following the structural pattern that we have been defining on the blog for the past few days. Elliott Wave analysis suggests that the recent decline has been a 3-wave down affair. 3-Wave moves are corrective in nature and therefore, this means that higher highs can be expected in the future. Following structure shows this wave count.


Please note that some Elliott Wave practitioners are interpreting current decline in different ways. However, we will not delineate the alternatives as they don't really add value to trading. What does add value to trading is the IPM Trade Matrix's trades in conjunction with the IPM Turn Window. IPM Trade matrix will enter a trade during the next IPM Turn Window based on market completing proprietary trigger levels.

Next week will be very interesting for the markets. Jenet Yellen (New Fed Chairwoman) will be testifying in front of the congress. She will address her approach towards QE policy and economic activity in the U.S. We also are approaching the new debt ceiling deadline (Feb 27). As we have seen in the past, markets can get very interesting during the debt limit debate in the congress. Therefore, markets will have a lot to absorb next week.

Market should stay above 1735 (SP500) to maintain the bullish argument. 


IPM Trade Matrix 2014 Trades

TRADE - 1: (Long) = +2.6%
TRADE - 2: (Short) = +9.3%
TRADE - 3: (Long) - Non IPM Trade Matrix trade = -0.2%
TRADE - 4: (Short - 1/31/14 to 2/5/14) +7.25% 

TRADE - 5: Long/Short?

TRADE CONDITIONS
Condition: Within IPM Turn Window (Bottom/Top) - Info already sent to subscribers
Trigger: - 
Supporting Indicators: Up Trend OR Absence of decline intensity + Next IPM Turn window is 3+ weeks away

PROFIT TARGETS
Profit Target 1: -
Profit Target 2: - 

RISK
Stop: After trade is triggered
Trailing Stops: - 
Typical IPM Trade Matrix Risk: 1.5%
Actual IPM Trade Matrix Risk: N/A (Entry = - , Exit = - , Risk = - )
Risk Reason: -

Applicable Rule: 
  1. Do not go long or short without trigger to prevent losses by market moving against you.  
  2. Will be shared over the next week

Note: IPM Trade Matrix Trades will be posted in the first half of 2014. This is an experiment to understand and enhance the capabilities of this Matrix.

For Real Time Blog updates, add to Google+: Understand Survive Thrive 
For Real Time Blog updates, add to Twitter @survive_thrive


Thursday, February 6, 2014

Market Analysis, Employment Data and Trade

Today's market rally came as expected. Although today's rally took many by surprise, others got even more bearish on stock market's future direction. This can be a good or bad assumption. There is no way to know for sure if the market is going to go up or down, ahead of time. However, one thing that we do know is that the market is setting up to follow scenario 2 (as defined in last nights update).

We will continue to monitor market's structural developments in conjunction with the IPM Turn Date and Market Matrix.

Tomorrow morning will bring non-farm payroll data. Although this report will give clarity on job creation activity in the U.S., structurally markets are getting ready for a rally tomorrow. Following chart shows scenario 2 in close-up.


Based on this structural interpretation, market (SP500) could rally up to mid-1780s. This rally will give way to a sharper decline.Although one can use alternative counts to talk about other possibilities like new lows into high 1600s, we will keep it simple and let the market show us its hand. This means that we will use IPM Trade Matrix to trade during the next IPM Turn Window.

As far as the IPM Trade Matrix is concerned, today's rally validated Trade Matrix's yesterday's exits based on statistical analysis and proprietary exit criteria. With yesterday's exits, we are now all cash and waiting for next IPM Trade Matrix signal.


IPM Trade Matrix 2014 Trades

TRADE - 1: (Long) = +2.6%
TRADE - 2: (Short) = +9.3%
TRADE - 3: (Long) - Non IPM Trade Matrix trade = -0.2%
TRADE - 4: (Short - 1/31/14 to 2/5/14) +7.25% 

TRADE - 5: Long/Short?

TRADE CONDITIONS
Condition: Within IPM Turn Window (Bottom/Top) - Info already sent to subscribers
Trigger: - 
Supporting Indicators: Up Trend OR Absence of decline intensity + Next IPM Turn window is 3+ weeks away


PROFIT TARGETS
Profit Target 1: -
Profit Target 2: - 

RISK
Stop: After trade is triggered
Trailing Stops: - 
Typical IPM Trade Matrix Risk: 1.5%
Actual IPM Trade Matrix Risk: N/A (Entry = - , Exit = - , Risk = - )
Risk Reason: -

Applicable Rule: 
  1. Do not go long or short without trigger to prevent losses by market moving against you.  
  2. Will be shared over the next week

Note: IPM Trade Matrix Trades will be posted in the first half of 2014. This is an experiment to understand and enhance the capabilities of this Matrix.

For Real Time Blog updates, add to Google+ @ Understand Survive Thrive