Twitter

Sunday, December 18, 2011

End of Year Rally or Wash-out!!!

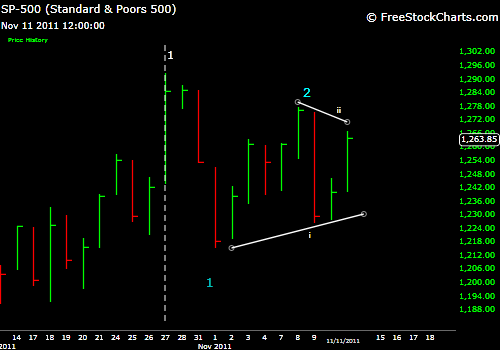
Although the UST proprietary market index is in a downtrend and in a pronounced bear market, major indices like SP500 and DJIA are holding up. However, the following chart shows the possibility of a series of 1s and 2s in the stock market. If this Elliott Wave analysis is true, we might be in for a sharp decline really soon.

On a larger scale, markets are tracing out a Head and Shoulder's pattern. This pattern would mean that we are about to embark on a sharp down move. This pattern will be confirmed of a decline below 1185 (SP500.


INFLECTION POINT MODEL:
The Inflection Point Model predicted that the markets could top on December 5, 2011. Dec 5 has so far turned out to be the top date for Nasdaq and Russell 2000, with DJIA and SP500 topping 2 days later. It seems like the next turn date is 2-3 weeks away (chart given below). Exact date has been calculated and will be sent to the subscribers. Please note that IPM showed a top when everyone was looking forward to the end of year, Santa Claus rally.
Lets see what the last two weeks of 2011 bring for the markets. Please note that according to our wave and time analysis, we are about to witness a sharp decline in to the end of the year. As always, this scenario is bounded with 1250 (SP500) level. A break above this level, will nullify the decline potential.

SHORT TRADE:
We will bring down the stops to 1230, once the market decline sharply.

Note: UST market update frequency will increase after December 21, 2011

Wednesday, December 14, 2011

Trading Algo - 12/12/11


Market: Bull (SP500) / Bear (New Index)
Defining Level: 1216 (SP500)
Trend: Up (SP500) / Down (New Index)
Defining Level: 1203 (SP500)
8/4 Trend Change Confirmation (Down to Up): Yes (SP500) – Trend Reversal Confirmed in New Proxy
Current Trade: Short from 1243
Profit Objective 1: 1205                                                 Trailing Stop (closing):  1250
Profit Objective 2: 1168                                                 EW Stop: 1250
Status: 
Next Trade / Model Based Approach: N/A
Stop:                                                                             Risk (%): 
Risk Associated with trade: 
Turn Window: November 29 (-2/+4 days)
Market completes rally and tops
Scenarios
1-   Market bottoms in turn window
2-   Market tops in turn window
3-   Market double bottoms and breaks out
4-   Market double tops and breaks down
Observations:  
IF the market continues its downtrend, we will soon see acceleration to downside. Another evidence of us being in a bear market is the fact, market failed to close above the 200 DMA on numerous occasions. Without going into details, it appears that the New Proxy index was once again accurate in predicting that we will stay in the bear market for a long period of time. All of this information was shared with subscribers.

This kind of market behavior brings to light the need for patience and persistence, when analyzing the markets. UST Trading Algo pretty much stayed on the sidelines during the choppy month of November (we were short from 1240, but got out just before the big decline because of over analysis!!!), which in itself is a huge achievement.   


A special Euro Update was mailed to Subscribers on Monday. Although this report was written before the EU summit, it predicted that Euro will decline sharply based on a 5 year long pattern. This week Euro came down from 1.337 to 1.299. If you want this special Euro analysis report, please send an e-mail to: subscription.ust@gmail.com


Friday, December 9, 2011

Over Analysis and Trading!!!

There has not been any updates because I did not want the market to whipsaw my thinking again. Over analysis is bad for trading. It deviates one from the major theme. Anyways, a detailed update will be sent tonight. 

Over the last several days, market has gone net sideways. Optimism has came back into the market as seen from from Investor Intelligence, Rydex, Vix and options data. Since we are now in an uptrend, shorting will be risky. As you know that the last IPM turn window expired on Monday, I was waiting for a decisive close above Monday's highs before saying that we will start going up. So far, many indices have topped on Monday!!! On the technical indicators side, the market rally has been very week. All of these developments, in conjunction with the fact that the market is testing its 200 DMA forced me to not confuse myself and the readers by over analysis. 

Therefore, we can say that as long as SP500 does not convincingly break above 200 DMA, one should not go long. If it breaks above 200 DMA, one will re-evaluate the wave pattern and time symmetry to identify potential trades.

Please note that the Euro has not risen as sharply as SP500. There is no guarantee of what kind of decision the EU leaders will take this week. But in the long term, Euro is tracing out a very large HS pattern. This pattern will be discussed in the upcoming blog post. If this pattern is completed i.e. Euro declines below 1315, then the target is in low 1.20s. If this happens, it will significantly affect the stock market. 

Note: Does it mean that the charts are showing us that we are on the verge of a collapse???

Anyways, right now might be a good time to short the market on a decline below yesterday's low and keep a stop above 200 DMA i.e. any where from 1270-1273 etc.

Note: Look at how the market collapsed this morning. Over analysis is not good.

Thursday, December 1, 2011

Crazy Market!!!


This is one of the craziest markets, I have seen since 2008. It kind of reminds me of September 2008 market action, when the market declined for several days and then suddenly jumped up for two days, taking back all the losses. However, this rally was just a bear market rally and what followed was the sudden market crash (late September and early October).

It is so strange that back in 2008 everyone was talking about the financial problems and the government was trying to take action. However, now the European governments are just sitting tight and letting the market decide their fate. Under such circumstances, Central Banks’ intervention is even more dangerous: Central Banks’ know the gravity of the problem, while the investors and governments stay indifferent to it.

So where does it leave us?

First of all, we were in a Bull market from April 2009 to July 2011 (according to UST Bull/Bear filter). But we never saw a 490 point rally during this period. Why?? Does this mean that markets do not rally this hard in Bull markets? However, we did see several 500+ point rallies during the 2008 bear market. There must be some pattern!!!

Full market analysis has been sent via e-mail...

Wednesday, November 30, 2011

How Bad Is IT??

The situation must be really bad that the Fed had to intervene. Is this a good shorting opportunity??? Or have we bottomed?? We are in the IPM turn window!!! Details will come soon...

One thing is for sure, market is throwing so many participants off its back - It must be getting ready for something big in December???


DECEMBER to REMEMBER!!!

Subscribers will get detailed analysis and risk-management levels tonight...

Monday, November 28, 2011

Stock Market Overview - 11/28/11

MARKET REVIEW
Predicted
Happened


Last week’s special Market Matrix update pretty much summarized the sentiment and Elliott Wave picture and highlighted the reasons behind uncertainty i.e. Inflection Point Model turn dates. The analysis came to two conclusions:

1-     If the market declines sharply in conjunction with a sharp rise in US Dollar then it would suggest that we entering a sharp decline phase. Soon we will start seeing bad economic data and European crisis will get worse.
2-     On the other hand, if the market stays above 1200 and US Dollar starts to decline then it would mean that markets bottomed during the IPM turn window and will rise for 1-2 weeks.

By breaking below 1200 last week, SP500 completed the 8/4 test which resulted in a downside reversal. Afterwards, market swiftly declined to 1158. Now we are in a well-defined Bear market. 

As far as the fundamental developments are concerned, the sovereign debt crisis is spreading to the core of European Union. Since markets do not go down in a straight line, we will see rallies based on hope and anticipation. However, until unless we see a trend reversal, all rallies will be good shorting opportunities (like the end of October rally, which was rightly named as wave 2 rise by UST).


TRADING ALGORITHM REVIEW

Although UST Trading Algo did not lose any money as the market declined more than 7% (1250 to 1160), it missed out on an exciting shorting opportunity. The worst part is that the UST Trading Algo was on the right side of the trade i.e. shorted  SP500 at 1241 and did not generate a buy signal. However, it was human emotions that overcame the Algorithm and short positions were closed around 1250. In other words, market succeeded in throwing us off its back by gyrating sideways, before the major decline.

As a result, a comprehensive trading strategy re-evaluation was performed over the Thanksgiving break. The goal was to further reduce emotional aspect of trading. This was achieved by realizing the fact that trading strategies should be treated using varying order of significance. And that trading in direction of the primary trend should be held above signals generated by IPM or Elliott Wave analysis. Furthermore, a better proxy index was identified, which adheres to the trading rules much more smoothly than SP500. 

After comprehensive evaluation, a trading scheme has been devised for different types of markets (Bull vs Bear). This trading scheme will be posted online in the next few days.


CURRENT MARKET ACTION

As far as the current market is concerned, it is alarmingly to see that market participants are not exhibiting any signs of real panic.  Although the market has declined more than 7% in less than 2 weeks, there has not been any spike in volume, surge in pessimism, jump in put-call ratios or any other sign of capitulation. Market structure favors further decline and the supporting markets are showing no support. 

In other words, we are most probably headed towards a test of the October lows, until unless we can break above 1220. However, one thing that is currently in market’s favor is the fact that it is pretty oversold. Hence, we can see a sharp rise for a few days. Please keep in mind that this rally could be a good shorting opportunity.

Overall, we are now in a well-defined downtrend and are back in the Bear market territory. Typically, markets whipsaw only once before changing their trend. If this is true then we have most likely already seen the whipsaw:

Bull => Bear - 08/2011  => Bull (Whipsaw) -10/2011 => Bear (Final) - 11/2011

Normally, Bull or Bear market remains intact for several months. Therefore, if we do not break above 1220 real soon (by the end of the year), we will most probably remain in a bear market for the next several months. Under such circumstances, the best strategy would be to pick tops during the IPM turn dates.

Please keep in mind that like a Bull Market when the market rises persistently, in a Bear Market, market will fall. Although we will experience sharp rallies along the way, market will continue to decline with a series of lower highs and lower lows. So the task should be to identify the primary trend, pick trading locations, manage risk, take profits and re-evaluate. I hope that the enhanced trading scheme analysis will bring some clarity into current trading atmosphere.


Market update schedule (tentative):

11/28/11: Market Overview
11/29/11: Inflection Point Model (Primary Subscribers)
11/30/11: Trading Scheme Update + Trading Algorithm Update (Subscribers)
11/31/11: Trading Scheme Update
12/1/11: Trading Algo Update (Primary Subscribers)


Monday, November 21, 2011

Market Matrix Analysis

Market Matrix Update has been sent to subscribers. Addressing the following topics:

1- Market structural analysis
2- Trend defining levels
3- Current Sentiment and its implications
4- Technical Indicators
5- Inflection Point Model and its current status
6- Supporting market structures

along with fundamental developments in the economic world.


CONCLUSION
  1. If the market declines sharply in conjunction with a sharp rise in US Dollar then it would suggest that we entering a sharp decline phase. Soon we will start seeing bad economic data and European crisis will get worse.
  2. On the other hand, if the market stays above 1200 and US Dollar starts to decline then it would mean that markets bottomed during the IPM turn window and will rise for 1-2 weeks.


These are very interesting times. Even if the downtrend is confirmed, we will wait for a better shorting opportunity to minimize stop-loss risk.

Wednesday, November 16, 2011

Market Story Update


  1. Weekly IPM update and its implications (NEW) - SENT
  2. Daily IPM update and its implications - SENT
  3. Market's structural analysis: Various potentials and strategies - SENT
  4. Market's sentiment analysis
  5. Regular and Customized Technical indicators 
  6. Supporting markets' structures
  7. Time symmetry and potential reversals
  8. Trading Algo Updates
  9. Market Matrix Update
  10. Market Barometer (NEW): Will statistically weigh all the above mentioned analysis techniques as parameters and then generate a total market directional probability - WILL BE SENT

Tuesday, November 15, 2011

Market Overview - November 15, 2011

Financial markets have gone sideways over the last two weeks. This kind of sideways action means that the market is coiling up energy to break in either up or down direction. Along with the price action, technical indicators are also coiling up energy. This would lead to a sharp move in the stock market. Therefore, one should be ready with strict risk-management strategies.

There have been various instances in the past when such sideways movement resulted in market tops. Plots of previous major tops (April 2010 and Feb 2011) are shown below. If we are currently witnessing a top formation, it would suggest that the market is tracing out a series of 1s and 2s, which would lead to a sharp decline to 1100s in SP500. Under this scenario, market should not break above 1275 (SP500).

April 2010 Top


Feb 2011 Top


Nov 2011 Top?

This development in conjunction with the detailed market structural analysis, Fibonacci relationships and supporting market structures (sent to subscribers last week), support the fact that the market has completed a counter trend rally from October 4, 2011 low. 

At the same time, optimism is also reaching elevated levels as seen through Individual Investors, Rydex investors and other ratios. Therefore, sentiment is supporting the possibility that markets topped on October 27, 2011 (until unless market breaks above 1275 SP500).

During the recent sideways market action, it was noticed that bulls got emboldened and started to bet on the Santa Claus rally. Furthermore, recent up down gyrations whipsawed a lot of investors out of the market. Since markets are notorious about getting rid of majority of traders (long or short) before initiating the major move, we might be on the cusp of sharp move in the financial markets (rally or decline). 

Tonight or tomorrow, Understand, Survive and Thrive will publish the Daily Inflection Point Model, this model has some very important dates to keep in mind over the next few weeks, especially with respect to End of Year Rally.

Sunday, November 6, 2011

Market Structural Overview


As US stocks rallied during the last 5 weeks, sentiment also got more optimistic. This is not good for the market. According to Mark Hulbert, “The HSNSI is now 51 percentage points higher than where it stood a month ago. To put that in context, consider that over the first month of the last six bull markets, the HSNSI never grew by that much. In fact, the average increase in this sentiment index over each of those six bull markets’ first month was just 19.9 percentage points.” This kind of behavior symbolizes the fact that we might not be in a bull market, rather are experiencing a bear market rally.

We have already discussed the potential of a turn point based on Daily and Weekly Inflection Point Models. (Please review earlier IPM posts). Today, we will look at the markets from a structural point of view.

5 Wave Decline = Downtrend
All major US Indices (SP500, DJIA, Russell 2000 and Nasdaq) declined in clear 5 wave fashion from May 1st 2011 to October 4th 2011 (shown below  - figure 1). 5 wave movements are regarded as impulsive moves. Impulsive moves occur in the direction of the primary trend. This decline terminated in the form of an ending diagonal. Please note that October 4, 2011 turn occurred during the last turn date September 28, 2011 (+/- 4 days)
Figure 1

One of the characteristics of 5 wave declines is that 4th wave does not enter Wave 1. However, in case of Nasdaq, Wave 4 entered the Wave 1 region (shown below – Figure 2). This means that Nasdaq carved out a wedge formation. Wedge formations either occur at the start of a trend or at the terminating location. In July 2010, markets carved out a similar wedge formation in the upward direction. This wedge was followed by a sharp decline in wave 2 through August 2010, retracing 0.786 (Fibonacci ratio) of the prior rise. In late August, many investors assumed that it was the start of a new downtrend, but soon thereafter markets staged a very sharp rally to new highs.

Since current wedge formation was to the downside and it was followed by a sharp rise, retracing 0.786 of the previous decline, it might be possible that markets will start a new decline phase to new lows below October 4th low.


3-Wave Rise = Counter-trend Rise
Since October 4, 2011, markets have risen for almost 5 weeks. Although this sharp rise managed to entice many to believe that the uptrend has returned, it did not result in an impulsive rally structure (5 waves). Rather, we have seen only a 3-wave rise (figure 3). ABC patterns (3-waves) are a hallmark of corrective wave, and can retrace anywhere from 38.2% to 78.6% of the prior move. In case of 2nd waves, the retracements are steeper. Recent market rise since October 4, 2011 retraced almost 78.6% in all the major indices.  According to Elliott Wave theory, 2nd waves are defined as: “Wave 2s are very deceiving, and they are technically broken.” It will be highly ironic to see Wave 2 end on the news that a bailout package was negotiated in Europe.

This article is continued for subscribers... If you want to continue reading about:
1- Counter trend rally
2- Anomalous behavior of the QQQs
3- Recent market action
4- Head and Shoulders Top
5- 8/4 Test
6- Supporting structures of Euro, Treasuries, US Dollar Index and European markets

Sign up below: 

Market Story - 11/6/2011


  1. Weekly IPM update and its implications (NEW) - SENT
  2. Daily IPM update and its implications
  3. Market's structural analysis: Various potentials and strategies - WILL BE SENT 11/7/2011
  4. Market's sentiment analysis
  5. Regular and Customized Technical indicators 
  6. Supporting markets' structures
  7. Time symmetry and potential reversals
  8. Trading Algo Updates
  9. Market Matrix Update
  10. Market Barometer (NEW): Will statistically weigh all the above mentioned analysis techniques as parameters and then generate a total market directional probability

Friday, November 4, 2011

Market Synopsis - 11/04/11


Since the last blog post titled Vix Up 20% - WHY??, market has been going up. However, it seems like the trend is exhausting. Therefore, one should be very careful with tight stops (if long).


The primary reason why it seems like that the trend has reversed is because the initial decline from 1291 to 1217 was a complete 5 wave affair. 5 Waves represent trend reversal. Furthermore, this initial move from 1291 to 1217 was very violent, hinting to the possibility that we have entered a downtrend. The subsequent rise from 1217 to 1261 has come in the form of choppy market action. Choppy action is a hallmark of a countertrend rally (wave 2). Finally, recent rally has retraced 61.8% of the initial decline. 61.8% retracements are typical retracements for counter-trend rallies. All of these observations are shown below.


At the same time, the sentiment has become very optimistic again. This optimism in the face of a declining to sideways market is dangerous for future market rally. 


8/4 Test:

Subscriber Only


STRATEGY
Subscriber Only

Thursday, November 3, 2011

Inflection Point Models

Interesting Summary - Confluence of turn dates and 8/4 test reversal!!!


Detailed Inflection Point Model Output + Analysis ==> Subscribers

Tuesday, November 1, 2011

Vix Up 20% - WHY??

Why is the Vix up 20%?  Just on the assumption that Greece is going to carry out a referendum??? Vix wasn't this high when EU did not have an agreement, but now they do have an agreement!!

If Greece's Prime Minister wanted to listen to the people of Greece, he would have listened earlier when they were protesting.

In any case, buying right here might be a very dangerous trade but can be a very interesting trade also, with markets re-testing the Up-trend demarcation MA. It also offers low risk entry for a quick profit!!

We will see.

Note: This trade does not mean that we are going to new all time highs, it just means that right now market is a little over-reacting.

Saturday, October 29, 2011

ONE WHOLE YEAR!!!!

One year ago, on October 29, 2011 Understand, Survive and Thrive's first blog post was published. It has been a great year.

Today I will start by thanking God, who bestowed on me the passion, drive and skill of writing clearly and of explicitly conveying my message. Believe me it is a gift because at one point in my life, I did not know how to compose an essay. He also enabled me to comprehensively and uniquely analyze the financial markets (not as a full-time profession, but rather as a full-time hobby).

I would also like to thank all who have supported Understand, Survive and Thrive, by being a continuous reader of the blog posts and market analysis. And most importantly, I would like to extend my sincerest gratitude to my family and friends who encouraged, helped, and supported me during every aspect of life!!! Thank You all for your help and support..

Upcoming in November
Recent market research has brought forward few very interesting observations. These observations prompted a re-run of the Inflection Point Model on both Daily and Weekly time frames. It is important to note that weekly IPM turn dates have been very accurate in the past. Some of the past predictions of the Weekly IPM include: May 2011 top, July 2010 bottom, March 2009 bottom etc. So, when there is a turn date projected in this mode, it is worth noting.

In a nutshell, research shows that November and December can be very eventful. The question is: In which direction? Up or Down. These questions will be answered through following market analysis (will be sent to subscribers via e-mail):

  1. Weekly IPM update and its implications (NEW)
  2. Daily IPM update and its implications
  3. Market's structural analysis: Various potentials and strategies
  4. Market's sentiment analysis
  5. Regular and Customized Technical indicators 
  6. Supporting markets' structures
  7. Time symmetry and potential reversals
  8. Trading Algo Updates
  9. Market Matrix Update
  10. Market Barometer (NEW): Will statistically weigh all the above mentioned analysis techniques as parameters and then generate a total market directional probability

Note: Two new market analysis techniques will be introduced in November: Weekly Inflection Point Model and Autonomous Market Barometer.

All of this exhaustive market analysis will ultimately be combined into a single comprehensive Market Analysis report: "Market Analysis & TPI Story Line". This report will give a timeline based dissection of the stock market: How it ebbed and flowed, how it responded to various market shocks and how the Turn Point Identification Process unfolded. In future, it will be used as a blue print for maximizing UST services' potential profitability.

All market analysis components (mentioned above) will be available to the subscribers via e-mail. Although final decision about the pricing of the "Market Analysis & TPI Story Line" has not been taken, subscribers will receive at least 60% discount on this report, if not free. Although above mentioned analysis will take a lot of time and effort, hopefully it will help identify a very good trading opportunity for potentially significant profit generation.


Other Announcements:

  • Admin fee has been waived for 2011 
  • Market overview for October 30, 2011 will be published later in the week.
  • Q3 Newsletter will be issued either in late November or December, depending on market analysis work load.  
  • Subscription will close on November 1, 2011 (early morning)

In the end, I would again like to thank you for supporting Understand, Survive & Thrive. It has been an amazing journey.

If interested in this kind of Analysis, register now for Subscription Info.

Thursday, October 27, 2011

Predicted vs Happened - 3 of 3 Starts!!!

In the name of Allah the most Gracious, most Merciful

Last night Understand, Survive and Thrive provided a comprehensive market analysis from every possible angle, and wrote: "1220 level possesses strong support for the market."

Lets see what happened:
Predicted
Happened
Subscribers were told to keep stops at 1207 in the last Trading Algorithm Update. Since the stop was not hit, they are still in the trade with SP500 futures up more than 16 points right now. If the market holds its gains today, it would suggest that we have started wave 3 of 3. This pattern means that we are off to the races to at least high 1200s in the near term. 

Moving Forward
It seems like "8/4 Trend Reversal Test" was successful in identifying the trend change. Moreover, we have been working on a Trade Probability Calculator, to justify whether a trade should be undertaken or not. Probability Calculator's output will be shared with subscribers and blog readers in November -suffice to say, it has brought numerical clarity in our trading.  

Current IPM turn window has resulted in a significant market bottom, marking the start of 3 of 3 (the strongest rally phase).  Next IPM turn date has been calculated, and Subscribers will be informed about it next week. Subscribers will also receive updated detailed stop levels by Friday. Right now bring the stop up to 1221 (SP500).


If interested in this kind of Analysis, register now for Subscription Info.

Deadline: October 31, 2011

Wednesday, October 26, 2011

Bull vs Bear for a Confused Market


BULL CASE

Structure Р5 wave rise ̬ Wave 1 of 3
Following chart shows a clear 5 wave structural rise since Oct 20, 2011 bottom. 5 waves are usually followed by 3-wave corrections, like the one we are seeing right now. Moreover, market traced out a triangle during today’s decline. This suggests that we are in the final thrust lower of 2nd wave down. Once this correction is complete, market will start rising again.


Wave Relationship: Wave a = Wave c: 1220 (SP500), 61.8% retracement of Wave 1 move up from 1197 to 1254: 1220. Therefore, 1220 level possesses strong support for the market. If the market declines below 1197, it would suggest that we have topped and will decline sharply (look at the Bear Case).

Time: Today is the IPM turn date. Under such time based circumstances, it is a possible that market might bottom early tomorrow and then start a new rally phase (while still in the turn window).

Trend: One of the most important aspects of trading is the trend and right now, trend is up on all levels. We have regained the Bull Market status, uptrend has been confirmed by the 8/4 test, and we are in an uptrend even on shorter time-frame.

Sentiment: Today everyone on the TV was talking about the possibility of disappointment from Europe. This kind of behavior along with pessimistic readings from sentiment surveys suggests that we are closer to the bottom than to the top.

Indicators: Some of the technical indicators like NYSE stocks above 50DMA, TICK (10 DMA), NYAD (10 DMA) and others are showing incredible strength. Suggesting that current rally is not just a bear market rally, rather something more significant or at least long lasting.

Currencies: Currencies (EUR, AUD, GBP) are supporting patterns that portend a weaker dollar in the near future. Weak US dollar is good for the stock market


BEAR CASE

Structure – 3 Wave rise complete
Following chart shows the possibility of a completed 3 wave rise since October 4 low. Furthermore, the 2nd wave retraced 61.8% decline of the 1st wave down 1370s to 1070s (a common Fib relationship). This pattern would suggest that we will start declining in the 3rd wave down - one of the strongest down moves.


Although this pattern can result in a sharp decline, it is just too good to be true. With everyone looking at Europe and blogosphere filled with the 61.8% retracement information, it seems like a little too obvious stopping location.

Time: Since today was the IPM turn date, it might be possible that market topped out yesterday and is about to decline sharply. This is probably the strongest argument in favor of a continued decline.

Sentiment: Sentiment did get a little frothy, but it is nowhere close to a market top. However, one should keep in mind that sentiment does not get very optimistic when in a bear market. In the event, we would like to mention that we are not in a bear market – at least by our measures.

Indicators: Very few indicators are indicating bearish divergences. This does not support a sharp decline.

Trend: Trend is up, so UST will not undertake a counter-trend short trade before market reversal from up to down - market breaks below 1210 and 1197.


STRATEGY
Only for Subscribers