Twitter

Showing posts with label the stock market. Show all posts

Tuesday, October 25, 2016

Inflection Point Model - Performance Recap

Inflection Point Model predicted a market turn date on Oct 21, 2016. Market declined on the 21st and then rallied. The rally continued today and futures are up now. With new catalyst along the way in the form of earnings from Apple and Google, we can expect more gains. Good thing is that even with today's very powerful rally, there was no sell signal. This suggests that the trend remains intact and is strong.

IPM Output - Turn date 10/21/16
Following chart shows the IPM model's output, as shared on Oct 17th (link)
Market Structure
Analyzing IPM model in conjunction with the market structure showed us that the trend had been sideways to down since mid July. Hence, the likely scenario was for market to put in a bottom during the IPM turn window and rally.

Following chart shows the latest structure shared on the blog along with a blue box, highlighting potential market turn window.


Following chart shows performance of SP500 as of today i.e. after bottoming within IPM turn window on Oct 21, one can observe the green bar with a gap up. Today's performance shows that the market gaped-up but did not cover the gap, hence, hinting towards a strong move. At the same time, confusing so many market participants, who have been taking failure of rallies as the new norm. 


Next Steps
We will continue to evaluate the market with respect to its structure and Inflection Point Model. One of the biggest benefits of the IPM model is to forecast potential market turn dates. And when IPM turn dates are combined with Market Classification Modal, it paints a much clearer picture. 

Market Classification Model is bullish. Next run of the model will be in next few days. Once the model is processed, it will tell us whether the internal strength of the market justifies a continued bullish posture or should one be wary of market trend changes. This information will be shared with subscribers immediately, so that they may evaluate their long investment positions.

Tomorrow's market Action
So far the futures are up and we could see a  continuation of the rally. This rally has a lot going for it but there are some signs of tiredness appearing in the market. We will evaluate the market structure and next IPM turn window in upcoming posts.

If interested in free e-mail list or in paid services, please fill-out the form below.

Wednesday, February 19, 2014

IPM Trade Matrix Update - Trade 5 (Part 5)

Trade Overview
Today's market action was very constructive. While on one hand large caps like DJIA and SP500 absorbed recent gains by going sideways, small caps and tech stocks rallied sharply. This rally in small caps is a very encouraging sign for the broader market rally. Furthermore, breadth during this rally has been very impressive. 

Following chart shows a smoothed Advance/Decline line. According to this chart, market breadth hasn't been this strong in a while. 

Please note that this chart has two implications:
  1. We won't enter a new bear market right away i.e. current rally has a ways to go: 1929 comparison should not be taken seriously
  2. We might be approaching an overbought area and could see a pull-back over the next couple of weeks.
This chart also confirms IPM Trade Matrix's buy signal. The only difference is that the IPM Trade Matrix generated its signal several days before the breadth jump. Therefore, IPM Trade Matrix is a real-time actionable system with greater profit possibilities. 

Our Elliott Wave structural analysis of the market suggests that the market is in a firm uptrend. We are at least a week away from an intermediate term correction. Please note that this will not be a serious correction. It might just fill-out the right shoulder of the Inverted Head and Shoulder pattern (discussed earlier). IPM Top date has already been e-mailed to subscribers.


As evident from the above chart, market has just completed a sequence of 1s and 2s. As long as the stop levels are not broken (outlined below) we will stay long. If profit objectives for TNA are hit, we will bring our trailing stops closer per IPM Trade Matrix definitions and will let the market decide its next move.

Elliott Wave analysis cannot be completed without sentiment analysis. And current sentiment analysis suggests that we are still not seeing optimism in the market. This is  very good for the health of this rally. We will keep an eye on the stop levels and profit objectives, as we are approaching the end of Trade 5 per IPM Trade Matrix.


IPM Trade Matrix 2014 Trades

TRADE - 1: (Long) = +2.6%
TRADE - 2: (Short) = +9.3%
TRADE - 3: (Long) - Non IPM Trade Matrix trade = -0.2%
TRADE - 4: (Short - 1/31/14 to 2/5/14) = +7.25% 

TRADE - 5: Long
Long TNA at 70 ==> new TNA basis = 69.94 (added few longs today) 
Longs were initiated on 2/11/14 and 2/13/14 based on IPM Trade Matrix Trigger and Elliott Wave structure. More might be added if opportunity comes within IPM turn window. 

TRADE CONDITIONS
Condition: Bottom within IPM Turn Window  
Trigger: Rally above SP500 = 1789, DJIA = 15790, Russell 2000 = 111.5, Global Dow = 2401
Supporting Indicators: Up trend (8/4 did not complete), Next IPM can be either Top/Bottom

PROFIT TARGETS
Profit Target 1: 1870
Profit Target 2: 1930

RISK
Stop: Break below 1750 (valid till we are within IPM Turn Window)
Trailing Stops: Break below 1790 (SP500) and 15780 (DJIA)
Typical IPM Trade Matrix Risk: 1.5%
Actual IPM Trade Matrix Risk: 1.3% (Entry = 1813, Exit = 1790, Risk = 1.3% )
Risk Reason: There are multiple reasons to be worried: 1929 stock market parallel, 8/4 Test to the downside is in process (will be invalid at new highs) - almost invalid, and major IPM Bottom window in process - almost invalid.  

Applicable Rule (There are 7 Rules in the IPM Trade Matrix. Following are applicable to the market right now): 
  1. Do not go long or short without trigger to prevent losses by market moving against you.  
  2. Exit half at profit objective 1. Exit full at profit objective 1 if proprietary momentum continuation signals are not present.
  3. Observe stop-losses to minimize draw-downs

Note: IPM Trade Matrix Trades will be posted in the first half of 2014. This is an experiment to understand and enhance the capabilities of this Matrix.


For Blog updates on Google+ add: Understand Survive Thrive 
For Blog updates on Twitter, add: @survive_thrive
For E-mail updates: 

Sunday, February 16, 2014

IPM Model Update & Gold Breakout

IPM Model Update Has Been E-mailed to Subscribers.

IPM Trade Matrix Updates: IPM Trade Matrix Update - Trade 5 (Part 4)

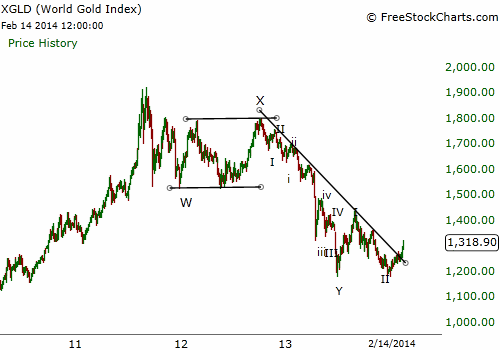
Gold & Silver are breaking out. There are several reasons to be optimistic about their prospects:
  1. 8/4 Test has been completed to the Upside in both Gold and Silver on both dail and weekly time frames. This suggests that the trend has reversed, and we should start looking for upside surprises. 
  2. Long-term trend lines have been broken to the upside.
  3. Sentiment had reached pessimistic extreme few weeks ago, which was in line with a generation precious metal bottom
  4. Bottoming process took its due course which is encouraging for the market
  5. Miners have really started out-performing the metal. This is another exciting and encouraging sign.
  6. Rally from the bottom has been impressive, and suggests a new trend has started.


Confirmation of a new Bull market will be a rally above 1460 in Gold.


For Blog updates on Google+ add: Understand Survive Thrive 
For Blog updates on Twitter, add: @survive_thrive
For E-mail updates: