Twitter

Showing posts with label Earnings. Show all posts

Saturday, February 4, 2017

January 2017 - Performance Review

January was an interesting month for the markets. In the beginning of the month, markets continued to go sideways, which they had been doing for past couple of weeks - since mid December 2016. Then came the earnings and market zoomed higher. Although this rally was not as significant as post election rally in 2016, it did bring back a lot of enthusiasm. The rally continued with President's oath taking. However, it experienced some difficulty towards the end, with the immigration executive order confusion and protests across the United States.

Following chart shows how SP500 performed in the first month of 2017:


To summarize January action, it was a volatile month. Volatility does not only impact our portfolio, it hampers our investment decisions, self-confidence and risk-taking abilities. In order to reduce the impact of volatility and realize long-term consistent results, UST team develop proprietary strategies based on our 8+ years of investing experience, as documented in this blog and other sources.

These strategies went live with real money at the start of 2016. Their 2016 performance has been documented here (link). Our team is currently working on more than 5 strategies. Two of these strategies have moved to production, two are in beta phase and others are in final development phases.  

Investment Strategies

Two strategies (one conservative and other aggressive) will be used for clients' investment needs. These strategies are customized to meet the performance and risk profile needs of investors. These strategies utilized strategic and tactical portfolio allocation techniques, along with proprietary market timing methods to generate Alpha with extremely low correlation with the benchmark SP500. Hence, have very high Sharpe Ratios.

Following chart shows January 2017 performance of Conservative and Aggressive strategies, directly taken from the brokerage account.

Conservative strategy performed 4.53% and Aggressive strategy gained 11.36%, while SP500 was up 1.90% in January.

Performance of these strategies is also tracked on OpenFolio to see daily changes. Following chart shows daily YTD performance for the Conservative Strategy:


Interested ? 

There are two ways to follow and invest in the strategy:
  1. Utilize some of the offerings that UST offers (link). We will officially start sending our Market Classification Model updates in February 2017. And plan to add additional services in the next few months.
Overall, we will actively be working on this blog to ensure that all the services are streamlined. If you have any questions please feel free to comment or interact with the team via Twitter @survive_thrive. Please use the below sign-up button to register for free newsletter or other services:


Monday, February 8, 2016

Employment Numbers, Economy and Market

Economy continues to perform below expectations. Latest job numbers were OK but not GREAT. I don't think they are even good enough to justify future rate hikes. But unfortunately Federal Reserves is locked into this situation where they have already committed several rate hikes for 2016. Although they won't do four hikes in 2016, any hikes will result in a flattening yield curve and possibly lead to negative yield curve.

Yield curve inversion typically leads to a recession. Although the numbers are not showing eminent recession right now, the stock market is now surely discounting a significant slowdown in economic activity. If the economy is to enter a recession, we could see further losses in the market.

From a socioeconomic perspective, a recession/bear market in the final year of election, could pave the path for a socialist president in the form of Bernie Sanders because people will be angry towards capitalists.

Getting back to economy, industrial activity has slowed considerably, which is an indication that the manufacturing sector is already in a recession. Number of job cuts being announced reminds us of the days of the great recession, when the news was always about reduction in workforce. When you have job-cuts coupled with tightening Fed policy, restricting the money flow, it just exacerbates the economic situations.

In fact, it leads the economy into a death spiral where one negative news feeds the other negative thing and so the cycle continues. For example, reduction in jobs will result in lower spending, which will in turn reduce profits, resulting in lower stock prices and cost-cutting measures, which will result in more job-cuts.

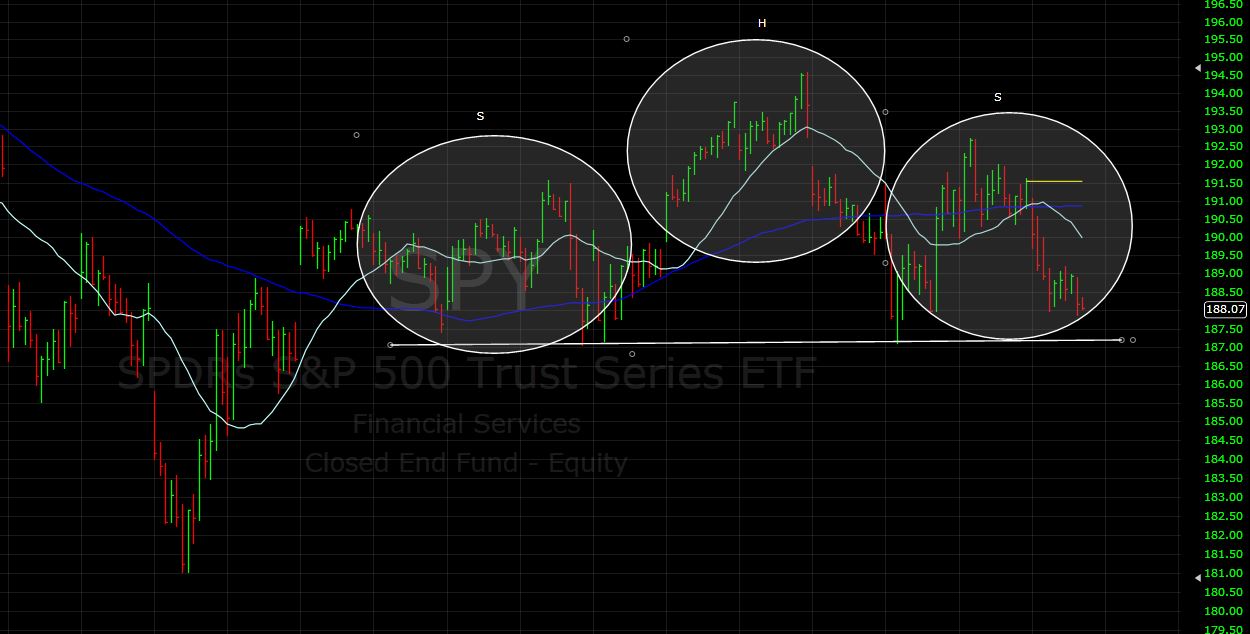
Under these circumstances, stock market is tracing out a series of mini-head and shoulders patterns. As you know head and shoulders pattern are topping formation. These patterns also appear in a downtrend as continuation patterns. Following chart shows H&S pattern in SP500.


If market declines in the next few days, this pattern will be broken and January lows will be tested. This will allow the market to complete the right shoulder of a longer-term head and shoulders pattern (discussed here)

Under these circumstances, the best option is to stay out of the market and wait for a trend change before going long again. Bonds remain in a bull market, so they can be a good place to park cash and ride-out this rough patch in the stocks, which could last for the next few quarters (at least).

Thursday, October 3, 2013

Another Decline But Why Such Disorder??

So today markets declined yet again, it can be attributed to president's panic button or to relentless bickering in D.C. In any case, market was down sharply in the morning. Although it recouped some of the losses by the end of the day, it still ended sharply in red.

There are two interesting aspects of this decline:

1- Except for DJIA, there is no order in the decline.  Market is going up and down, with some indices near the highs while others near the bottom of the range. This kind of behavior is not consistent with a start of a strong down trend.

DJIA is showing a sharp decline since September 18 peak.

Russell 2000 is showing sideways market action since September 18.

SP500 is showing a sideways to down action since Sept 18 peak. 

Cumulatively there is nothing impulsive about these three markets and their declines, which suggests that we should consider this decline as a correction within a primary up-trend.

2- Over the last 2-3 days, we have seen panic coming back into the market. Sentiment surveys have started to show less optimism. Moreover, we have also received 2 buy signals from VIX and NYMO indicators. Therefore, this is suggesting that market correction is approaching an end.

Based on this analysis in conjunction with the IPM turn window, it is possible that market might be setting up for a stronger rally than what we had anticipated 1 week ago. If DJIA breaks below August lows then rally scenario will take a back seat. 

Wednesday, July 13, 2011

Turn Point Action Plan - July 13 to July 22

We have finally entered the turn window, with the market declining over the past few sessions. This decline has brought back a lot of pessimism in the market related the European debt issues and US slow economic recovery.

After re-running the Inflection Point Models, following charts and conclusions were achieved. 
These models are suggesting that the next market turn date will be around July 19, 2011 (+/- 4 days). Therefore, the turn window from July 13 to July 22 is still valid. Furthermore, we are in the earnings season and many times market turns during early earnings weeks, after deceiving many by its initial decline. This week is also the options expiration week, which in itself brings many market turns.


On the other hand, market's recent decline was 5 wave, which suggests that after the market undergoes a partial bounce, it will again decline to 1290s. In any case, I will wait for the Trading algorithm to generate a buy signal before jumping in on the long side. Overall, the market is tracing out a nice base, as discussed in June posts, before exploding higher. Risk-Management is the key over here to ensure that we are not caught in market's trap.


Note: If the does not bottom during this turn window and continues to decline after July 22, 2011, then the markets might face severe downside risk.