Twitter

Showing posts with label Stock Market Rally. Show all posts

Thursday, March 16, 2017

Next IPM Model Turn Window

After briefly topping at the last turn date of Feb 28, 2017 (link), market rallied yesterday on Federal Reserve's announcement. 

Market Condition

  • During the correction since Feb 28, market did not generate any sell signals. In fact, it generated several buy readings from oversold perspective. 
  • At the same time, Sentiment as subsided in the past few weeks, which will provide fuel for this rally to continue. 
  • From a government perspective, they are busy with controversies and will not be able to influence the market. 
  • Furthermore, Dutch election results were positive for the overall geo-political situation

Hence there are no significant headwinds in front of the stocks right now.

We remain long the stock market because Market Classification Model remains bullish, which turned bullish on stocks in July 2016 and has remained bullish ever since (2017 Investment Performance). However, it is critical to understand potential future turn dates.

According to latest Inflection Point Model re-run, stocks will likely experience turbulence in the first week of April. Following chart shows the IPM model output.
IPM Model turn date is scheduled for April 5 (+/- 4 days). Most likely, this will turn out to be another intermediate top, which will last till majority of companies start reporting their earnings in mid April. However, it will be sufficient enough to make bears out of many longs. 

We will continue to evaluate the market conditions for any sell signals, as we approach this turn date. In the mean time, it seems like this rally could continue for another ~2 weeks.

If your interested in free e-mail list or in paid services like Market Classification Model, please fill-out the form below.

Sunday, February 16, 2014

IPM Model Update & Gold Breakout

IPM Model Update Has Been E-mailed to Subscribers.

IPM Trade Matrix Updates: IPM Trade Matrix Update - Trade 5 (Part 4)

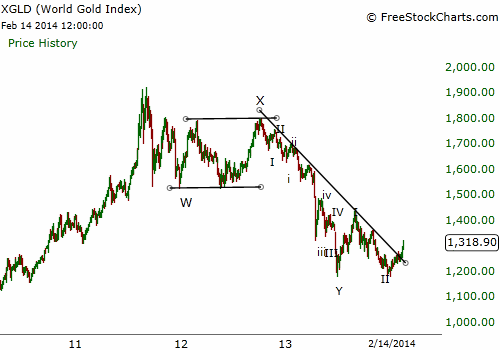
Gold & Silver are breaking out. There are several reasons to be optimistic about their prospects:
  1. 8/4 Test has been completed to the Upside in both Gold and Silver on both dail and weekly time frames. This suggests that the trend has reversed, and we should start looking for upside surprises. 
  2. Long-term trend lines have been broken to the upside.
  3. Sentiment had reached pessimistic extreme few weeks ago, which was in line with a generation precious metal bottom
  4. Bottoming process took its due course which is encouraging for the market
  5. Miners have really started out-performing the metal. This is another exciting and encouraging sign.
  6. Rally from the bottom has been impressive, and suggests a new trend has started.


Confirmation of a new Bull market will be a rally above 1460 in Gold.


For Blog updates on Google+ add: Understand Survive Thrive 
For Blog updates on Twitter, add: @survive_thrive
For E-mail updates:

Thursday, February 13, 2014

IPM Trade Matrix Update - Trade 5 (Part 2)

Markets corrected yesterday (going sideways) and are correcting this morning. This is what we have been expecting - a minor pullback, to setup further rally. If this pull-back continues till the last day of the IPM turn window, IPM Trade Matrix will go leverage long because the risk will be minimized. 

However, at this point, it seems like the market will continue higher and a deeper pull-back will ensue from a higher price level. As along as market can stay above Feb 5 lows, we are in good shape and will most likely see all-time highs.

At the same time, there are certain risks roaming the market and can derail this rally:
  1. Debt ceiling issue, which needs to be resolved by Feb 27th (Good progress has been made on the resolution)
  2. 1929 analog chart. If true, this chart would mean that the markets are headed for a crash like situation
  3. Tapering of the QE. It remains to be seen how will the market react to future tapers.
While on one hand these issues are a source of concern, they have also strengthened the Wall of Worry which Bull markets likes to climb. Therefore, it will be interesting to see how things unfold in the near future. As always, UST's trade decisions will be based on a totally objective IPM Trade Matrix, so that our judgement is not biased by market conditions.   


IPM Trade Matrix 2014 Trades

TRADE - 1: (Long) = +2.6%
TRADE - 2: (Short) = +9.3%
TRADE - 3: (Long) - Non IPM Trade Matrix trade -0.2%
TRADE - 4: (Short - 1/31/14 to 2/5/14) +7.25% 

TRADE - 5: Long
Long TNA at 70  
Longs were initiated on 2/11/14 based on IPM Trade Matrix Trigger and Elliott Wave structure 

TRADE CONDITIONS
Condition: Bottom within IPM Turn Window 
Trigger: Rally above SP500 = 1789, DJIA = 15790, Russell 2000 = 111.5, Global Dow = 2401
Supporting Indicators: Up trend (8/4 Test has not been completed), Next IPM can be either Top/Bottom

PROFIT TARGETS
Profit Target 1: 1870
Profit Target 2: 1930

RISK
Stop: Break below 1750
Trailing Stops: Will be identified in 1 week
Typical IPM Trade Matrix Risk: 1.5%
Actual IPM Trade Matrix Risk: 3.5% (Entry = 1813 , Exit = 1750 , Risk = 3.5% )
Risk Reason: There are multiple reasons to be worried: 1929 stock market parallel, 8/4 Test to the downside is in process, and major IPM Bottom window is in process.  

Applicable Rule (There are 7 Rules in the IPM Trade Matrix. Following are applicable to the market right now): 
  1. Do not go long or short without trigger to prevent losses by market moving against you.  
  2. Exit half at profit objective 1. Exit full at profit objective 1 if proprietary continuation signals are not present.
  3. Observe stop-losses to minimize draw-downs

Note: IPM Trade Matrix Trades will be posted in the first half of 2014. This is an experiment to understand and enhance the capabilities of this Matrix.


For Blog updates on Google+ add: Understand Survive Thrive 
For Blog updates on Twitter, add: @survive_thrive

Monday, February 10, 2014

Market Analysis and Upcoming IPM Trade Matrix Trade

Market has started consolidating its gains that it made last week. This consolidation can be a sideways affair or can result in a deeper decline. There are many market moving events coming up in the near future that could result in a market decline. Tomorrow Ms. Janet Yellen will speak to the Congress. Any of her mis-timed comments can result in a market decline.

This is a strange situation for the new Federal Reserve's Chairwoman.On one hand, she might want to justify the tapering of stimulus but on the other hand, she would also want to add that the Fed is ready to act with more stimulus. Therefore, markets can behave strangely tomorrow and on Thursday because she will again testify on Thursday.

Overall, market structure is ripe for a pull back. Market rallied sharply over the last week (as seen below) and needs to absorb these gains. From an Elliott Wave perspective, this could come in 2 different forms:

  1. Sideways & choppy market action for the next few days till market bottoms
  2. Sharp decline. This decline could either make new lows or result in a higher low

From an Elliott Wave perspective, market's higher low will be treated as the 2nd wave. This will be followed by a sharp rally, possibly to all time highs. Last time we saw a higher low during an IPM turn window was in February 2010. This low gave way to a ~2 month rally. We will continuously evaluate the market structure and trade base on IPM Trade Matrix.

Reason for not going long already is that one of IPM Trade Matrix's rule states that one should only trade after the trigger. Trade has not been triggered yet. Therefore, we are on the sidelines to prevent losses by market moving against us. Capital preservation is much more important than some gains without following the system.


IPM Trade Matrix 2014 Trades

TRADE - 1: (Long) = +2.6%
TRADE - 2: (Short) = +9.3%
TRADE - 3: (Long) - Non IPM Trade Matrix trade -0.2%
TRADE - 4: (Short - 1/31/14 to 2/5/14) +7.25% 

TRADE - 5: Long

TRADE CONDITIONS
Condition: Bottom within IPM Turn Window - Date info e-mailed to subscribers
Trigger: Rally above critical levels after a decline. Level will be outlined within next few days
Supporting Indicators: Up trend OR Absence of decline intensity + Next IPM Turn window is 3+ weeks away

PROFIT TARGETS
Profit Target 1: Will be determined after the entry
Profit Target 2: - 

RISK
Stop: After trade is triggered
Trailing Stops: - 
Typical IPM Trade Matrix Risk: 1.5%
Actual IPM Trade Matrix Risk: N/A (Entry = - , Exit = - , Risk = - )
Risk Reason: -

Applicable Rule: 
  1. Do not go long or short without trigger to prevent losses by market moving against you.  
  2. Exit half at profit objective 1. Exit full based on IPM Trade Matrix Rule #3

Note: IPM Trade Matrix Trades will be posted in the first half of 2014. This is an experiment to understand and enhance the capabilities of this Matrix.


For Blog updates on Google+ add: Understand Survive Thrive 
For Blog updates on Twitter, add: @survive_thrive

Saturday, February 8, 2014

Jobs Report and Market's ~200 Point Rally

While job report was not very good, markets rallied none the less (as mentioned in the last update). As a result of this rally, many bulls who had just turned bears near the bottom and were expecting a bigger correction, are now reverting to their bullish stance. This is the danger of investing blindly in the market without knowing the real drivers of the market.

Although fundamentals do drive the market to a certain extent, only price pays. Therefore, one should keep a close eye on the price before making an investment decision. 

At this point, with yesterday's sharp rally, price is following the structural pattern that we have been defining on the blog for the past few days. Elliott Wave analysis suggests that the recent decline has been a 3-wave down affair. 3-Wave moves are corrective in nature and therefore, this means that higher highs can be expected in the future. Following structure shows this wave count.


Please note that some Elliott Wave practitioners are interpreting current decline in different ways. However, we will not delineate the alternatives as they don't really add value to trading. What does add value to trading is the IPM Trade Matrix's trades in conjunction with the IPM Turn Window. IPM Trade matrix will enter a trade during the next IPM Turn Window based on market completing proprietary trigger levels.

Next week will be very interesting for the markets. Jenet Yellen (New Fed Chairwoman) will be testifying in front of the congress. She will address her approach towards QE policy and economic activity in the U.S. We also are approaching the new debt ceiling deadline (Feb 27). As we have seen in the past, markets can get very interesting during the debt limit debate in the congress. Therefore, markets will have a lot to absorb next week.

Market should stay above 1735 (SP500) to maintain the bullish argument. 


IPM Trade Matrix 2014 Trades

TRADE - 1: (Long) = +2.6%
TRADE - 2: (Short) = +9.3%
TRADE - 3: (Long) - Non IPM Trade Matrix trade = -0.2%
TRADE - 4: (Short - 1/31/14 to 2/5/14) +7.25% 

TRADE - 5: Long/Short?

TRADE CONDITIONS
Condition: Within IPM Turn Window (Bottom/Top) - Info already sent to subscribers
Trigger: - 
Supporting Indicators: Up Trend OR Absence of decline intensity + Next IPM Turn window is 3+ weeks away

PROFIT TARGETS
Profit Target 1: -
Profit Target 2: - 

RISK
Stop: After trade is triggered
Trailing Stops: - 
Typical IPM Trade Matrix Risk: 1.5%
Actual IPM Trade Matrix Risk: N/A (Entry = - , Exit = - , Risk = - )
Risk Reason: -

Applicable Rule: 
  1. Do not go long or short without trigger to prevent losses by market moving against you.  
  2. Will be shared over the next week

Note: IPM Trade Matrix Trades will be posted in the first half of 2014. This is an experiment to understand and enhance the capabilities of this Matrix.

For Real Time Blog updates, add to Google+: Understand Survive Thrive 
For Real Time Blog updates, add to Twitter @survive_thrive


Thursday, February 6, 2014

Market Analysis, Employment Data and Trade

Today's market rally came as expected. Although today's rally took many by surprise, others got even more bearish on stock market's future direction. This can be a good or bad assumption. There is no way to know for sure if the market is going to go up or down, ahead of time. However, one thing that we do know is that the market is setting up to follow scenario 2 (as defined in last nights update).

We will continue to monitor market's structural developments in conjunction with the IPM Turn Date and Market Matrix.

Tomorrow morning will bring non-farm payroll data. Although this report will give clarity on job creation activity in the U.S., structurally markets are getting ready for a rally tomorrow. Following chart shows scenario 2 in close-up.


Based on this structural interpretation, market (SP500) could rally up to mid-1780s. This rally will give way to a sharper decline.Although one can use alternative counts to talk about other possibilities like new lows into high 1600s, we will keep it simple and let the market show us its hand. This means that we will use IPM Trade Matrix to trade during the next IPM Turn Window.

As far as the IPM Trade Matrix is concerned, today's rally validated Trade Matrix's yesterday's exits based on statistical analysis and proprietary exit criteria. With yesterday's exits, we are now all cash and waiting for next IPM Trade Matrix signal.


IPM Trade Matrix 2014 Trades

TRADE - 1: (Long) = +2.6%
TRADE - 2: (Short) = +9.3%
TRADE - 3: (Long) - Non IPM Trade Matrix trade = -0.2%
TRADE - 4: (Short - 1/31/14 to 2/5/14) +7.25% 

TRADE - 5: Long/Short?

TRADE CONDITIONS
Condition: Within IPM Turn Window (Bottom/Top) - Info already sent to subscribers
Trigger: - 
Supporting Indicators: Up Trend OR Absence of decline intensity + Next IPM Turn window is 3+ weeks away


PROFIT TARGETS
Profit Target 1: -
Profit Target 2: - 

RISK
Stop: After trade is triggered
Trailing Stops: - 
Typical IPM Trade Matrix Risk: 1.5%
Actual IPM Trade Matrix Risk: N/A (Entry = - , Exit = - , Risk = - )
Risk Reason: -

Applicable Rule: 
  1. Do not go long or short without trigger to prevent losses by market moving against you.  
  2. Will be shared over the next week

Note: IPM Trade Matrix Trades will be posted in the first half of 2014. This is an experiment to understand and enhance the capabilities of this Matrix.

For Real Time Blog updates, add to Google+ @ Understand Survive Thrive 

Thursday, October 3, 2013

Another Decline But Why Such Disorder??

So today markets declined yet again, it can be attributed to president's panic button or to relentless bickering in D.C. In any case, market was down sharply in the morning. Although it recouped some of the losses by the end of the day, it still ended sharply in red.

There are two interesting aspects of this decline:

1- Except for DJIA, there is no order in the decline.  Market is going up and down, with some indices near the highs while others near the bottom of the range. This kind of behavior is not consistent with a start of a strong down trend.

DJIA is showing a sharp decline since September 18 peak.

Russell 2000 is showing sideways market action since September 18.

SP500 is showing a sideways to down action since Sept 18 peak. 

Cumulatively there is nothing impulsive about these three markets and their declines, which suggests that we should consider this decline as a correction within a primary up-trend.

2- Over the last 2-3 days, we have seen panic coming back into the market. Sentiment surveys have started to show less optimism. Moreover, we have also received 2 buy signals from VIX and NYMO indicators. Therefore, this is suggesting that market correction is approaching an end.

Based on this analysis in conjunction with the IPM turn window, it is possible that market might be setting up for a stronger rally than what we had anticipated 1 week ago. If DJIA breaks below August lows then rally scenario will take a back seat.