
Economy continues to perform below expectations. Latest job numbers were OK but not GREAT. I don't think they are even good enough to justify future rate hikes. But unfortunately Federal Reserves is locked into this situation where they have already committed several rate hikes for 2016. Although they won't do four hikes in 2016, any hikes will result in a flattening yield curve and possibly lead to negative yield curve.
Yield curve inversion typically leads to a recession. Although the numbers are not showing eminent recession right now, the stock market is now surely discounting a significant slowdown in economic activity. If the economy is to enter a recession, we could see further losses in the market.
From a socioeconomic perspective, a recession/bear market in the final year of election, could pave the path for a socialist president in the form of Bernie Sanders because people will be angry towards capitalists.
Getting back to economy, industrial activity has slowed considerably, which is an indication that the manufacturing sector is already in a recession. Number of job cuts being announced reminds us of the days of the great recession, when the news was always about reduction in workforce. When you have job-cuts coupled with tightening Fed policy, restricting the money flow, it just exacerbates the economic situations.
In fact, it leads the economy into a death spiral where one negative news feeds the other negative thing and so the cycle continues. For example, reduction in jobs will result in lower spending, which will in turn reduce profits, resulting in lower stock prices and cost-cutting measures, which will result in more job-cuts.
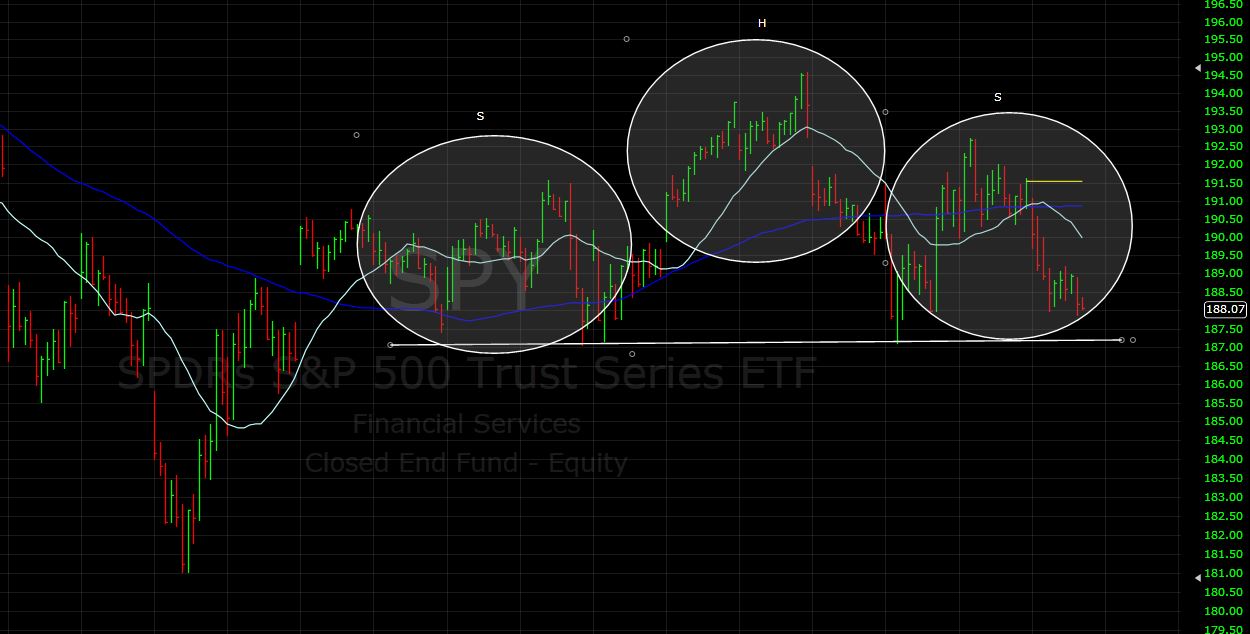
Under these circumstances, stock market is tracing out a series of mini-head and shoulders patterns. As you know head and shoulders pattern are topping formation. These patterns also appear in a downtrend as continuation patterns. Following chart shows H&S pattern in SP500.

If market declines in the next few days, this pattern will be broken and January lows will be tested. This will allow the market to complete the right shoulder of a longer-term head and shoulders pattern (discussed here)
Under these circumstances, the best option is to stay out of the market and wait for a trend change before going long again. Bonds remain in a bull market, so they can be a good place to park cash and ride-out this rough patch in the stocks, which could last for the next few quarters (at least).
Yield curve inversion typically leads to a recession. Although the numbers are not showing eminent recession right now, the stock market is now surely discounting a significant slowdown in economic activity. If the economy is to enter a recession, we could see further losses in the market.
From a socioeconomic perspective, a recession/bear market in the final year of election, could pave the path for a socialist president in the form of Bernie Sanders because people will be angry towards capitalists.
Getting back to economy, industrial activity has slowed considerably, which is an indication that the manufacturing sector is already in a recession. Number of job cuts being announced reminds us of the days of the great recession, when the news was always about reduction in workforce. When you have job-cuts coupled with tightening Fed policy, restricting the money flow, it just exacerbates the economic situations.
In fact, it leads the economy into a death spiral where one negative news feeds the other negative thing and so the cycle continues. For example, reduction in jobs will result in lower spending, which will in turn reduce profits, resulting in lower stock prices and cost-cutting measures, which will result in more job-cuts.
Under these circumstances, stock market is tracing out a series of mini-head and shoulders patterns. As you know head and shoulders pattern are topping formation. These patterns also appear in a downtrend as continuation patterns. Following chart shows H&S pattern in SP500.
If market declines in the next few days, this pattern will be broken and January lows will be tested. This will allow the market to complete the right shoulder of a longer-term head and shoulders pattern (discussed here)
Under these circumstances, the best option is to stay out of the market and wait for a trend change before going long again. Bonds remain in a bull market, so they can be a good place to park cash and ride-out this rough patch in the stocks, which could last for the next few quarters (at least).


