
Gold has been declining for the past 2 months. Gold spiked after Brexit vote but since then it has gone sideways.
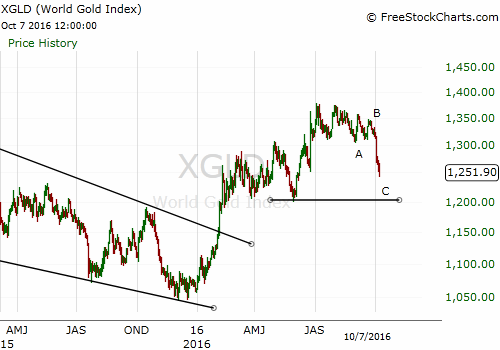
Above chart shows that the Gold bottomed at the end of 2015 and then rallied for more than 6 months. After topping in early July, Gold went sideways for 3 months before undergoing a sharp decline at the beginning of October'16.
However, interestingly, latest decline has just completed a 3-wave corrective structure in Gold. 3-wave corrections represent that the primary trend remains intact and we are just experiencing a minor pull-back in the asset.
A similar pattern is visible in Silver. But Silver is sporting a much more clearer structure. Recent correction was clear 3-waves with a triangle in the middle.

Furthermore, Silver is sporting a series of 1s and 2s which means that a big rally is coming in the Silver market. And when Silver starts to rally hard, it is a good time for Gold to follow.
Now that the Gold and Silver are showing that they are undergoing correction in broader uptrend, let's look at the Gold stocks. Gold stocks have rallied amazingly since the beginning of this year. Almost 200% rally from January bottom in GDX. Recently, they have also undergone similar correction over the past few months.
Following chart shows the performance of gold stocks:

Gold stocks clearly show a 3-wave decline, which means that this is just a correction and primary trend will resume soon.
Overall, the trend remains up in precious metals as shown by the market structure analysis. Market Classification Model also remains in a bull market for Gold. Therefore, we are very close to a bottom of this correction in Gold and will soon see a resurgence in the yellow metal.
If interested in free e-mail list or in paid services, please fill-out the form below.

No comments:
Post a Comment
I would love to hear from you! Please leave your comment below!!