Twitter

Showing posts with label Federal Reserves. Show all posts

Thursday, July 13, 2017

Stocks Approaching Dangerous Levels

Yesterday's rally in all of the major indices $DJIA, $SPX, $EEM, was very well received and triggered many tweets regarding Dow being at all time highs. Even President tweeted that stock markets are doing Great! I would recommend against such tweets because:
  1. What happens when the market goes down? If one owns a rising market, they would have to own the declining market as well, which could be much more negative.
  2. Market risks are increasing and we are close to a turn in the markets, which will correct post-election rally. Hence, a deeper correction can be expected. 
Following analysis supports the correction hypothesis (not a Bear market for now). Please note that below analysis is predictive and unlike mainstream finance, which is reactive, this analysis helps in understanding potential market move before time. This analysis also plays a pivotal role in our client portfolios (H1 2017 Performance has been shared). There are four key components:
  1. Structure
  2. Technical/Divergence
  3. Market Timing
  4. Sentiment
This correction could last for few weeks/months before resumption of the trend because we don't see a Bear market right away. But do you want to be part of a market when its going down and the headlines are negative? Some investment suggestions are included at the end.

Structure
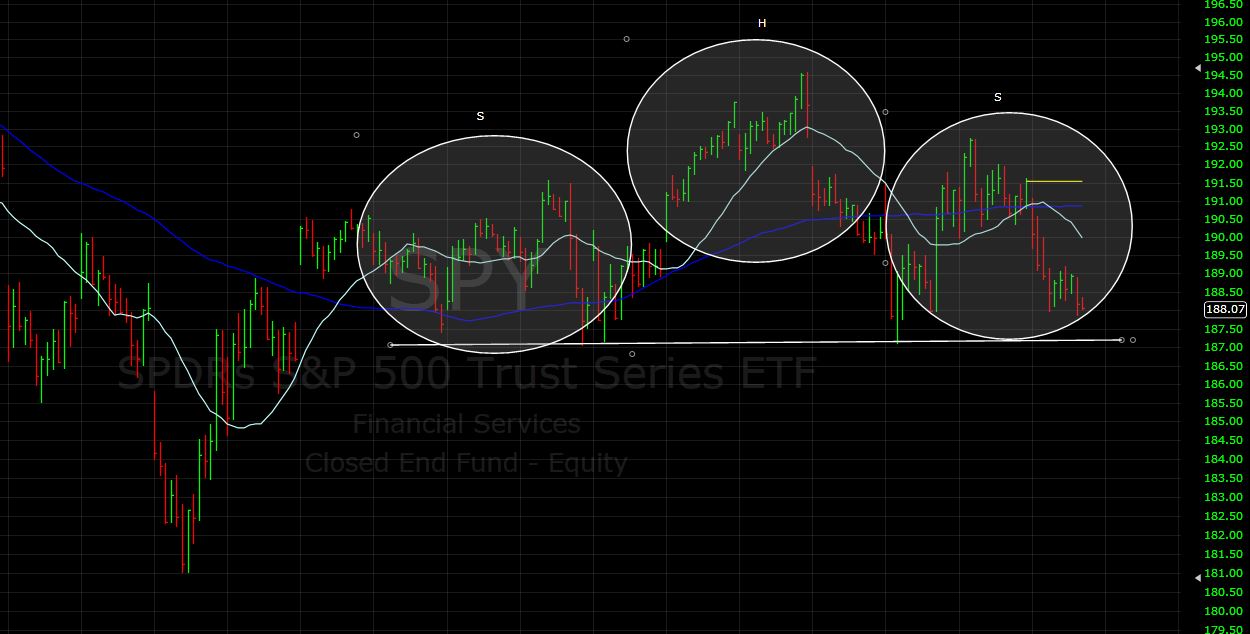
Firstly, the Elliott Wave structure is nearing completion. Once this 5-wave rally completes, we will see a decline. Next decline could bring DJIA back to ~20,500. As for the upside, if current structure (As shown below) holds, Dow Jones Industrial Average cannot exceed 22,000, which is less than 500 points from yesterday's close.


One of the lesson that we have learned over past several years of market analysis is that one cannot and should not blindly believe on Elliott Wave structure without considering the market backdrop.

Divergences
Inter-market divergences highlight discrepancies between markets. These discrepancies typically take place in 5th wave where markets start diverging. We can currently seeing a divergence between SP500, DJIA and Nasdaq (shown below).


Please note that these divergences don't mean that long-term trend has reversed. On the contrary, there are no signals (structural or momentum) that this decline could lead to a new bear market.

Timing
Our proprietary market timing model has a key market turn date scheduled for July 14 (+/- 4 business days). Therefore, we can expect a top by next week.
This model has worked very well in the past and also serves as a key component of our proprietary strategies. We are working on developing a unique trading system around IPM, with potential go-live in 2018.

Sentiment
Following charts show that sentiment is very elevated. 

Long positions in DJIA are at all time highs, which does not bode well for a sustained rally.

Investor Intelligence survey respondents are mired in the bullish region for quite some time, and same is the case with Naaim survey results (charts courtesy of Babak).


Lastly, these two are very interesting.

TD Ameritrade users are very Bullish and are showing it with their trades. Since these are real retail investors, them being so bullish doesn't bode well for the markets.
More than half of E-trade users are also optimistic regarding the prospects of the market, which is another warning signal (Courtesy Noon Six Cap)

Positioning
Markets are at a critical juncture. Preparing for such a decline will depend on personal risk tolerance and tax considerations. Everyone should evaluate their investments through following key investing questions:
  1. Am I ready for a stock market trend change?  
  2. Will I have the mental strength to go against the herd?  
  3. Can I take advantage of new opportunities?
If you think you have too much exposure to stocks, you can reduce some exposure to be able to buy again. If your comfortable taking a hit to the portfolio knowing that you might not be able to enter back in time, it's better to ignore the news and remain invested. Worst thing a person can do is not reduce exposure at top and then get stressed with market/news, ad get out at the bottom, only to see a resumption of the rally.

Alternative Solution: We are helping clients answer above questions every day. And have developed our proprietary strategies to generate consistent returns, while taking advantage of new market opportunities and minimizing existing risk. We aim to provide Absolute Return Hedge Fund like strategies for individual investors through Managed Account model.

Feel free to contact us with any investment questions or if you would like to invest with us (Performance - H1 2017):

  • Twitter: @survive_thrive
  • E-mail: subscription.ust@gmail.com 
  • Comment below
  • You can also sign-up for free email updates below: 

Tuesday, March 28, 2017

Financial Media and Stock Market

Over the last week, Financial News media is talking about how Trump will not be able to keep his promises given current political situation. Hence, continuation of the "Trump Rally," as it has come to be known, is in jeopardy. However, this is not correct and this is my problem with the media. News media needs a story and reports on everything after the fact because that is what majority of their readers can relate to.

They have done the same thing over and over again. Three big examples from 2016 include Brexit, US Elections and Oil crash of early 2016. In case of Brexit and US Elections, media did not have clue of what will happen in the actual vote. Everyone was complacent about status-quo remaining intact and no changes taking place. For example, UK staying in EU, while Hilary winning the White House.


Once both of these predictions turned out to be wrong, they focused on how negative will this development be for the overall stock market because of nationalistic policies, lack of growth and other issues. However, the market proved them wrong every time. And then they cam up with rational behind Trump rally or Post-Brexit stock market rally. These reasons range from additional liquidity by central bankers or business friendly presidency.

Brexit
US Elections
However, if you think about it for a minute, what would have happened had we seen the opposite results in Brexit Vote or US elections?
  • Brexit Vote: A vote to stay as part of EU would have also triggered a stock market rally but the rationale would be - it's a relief rally!
  • US Elections: A vote for Hilary Clinton would have also triggered a market rally with a rational of policy continuation and lack of uncertainty  
In either case we would have experienced higher prices but different rational. Therefore, financial news media had no idea regarding the cause of the rally and didn't know that the market would rally. They just react to market performance and come-up with justifications. If one had been following the financial media and acting accordingly, they would have lost a lot of money or at least had not participated in the market rally.

And right now, media is so focused on negative aspects of Trump administration that it is missing several opportunities. We discussed some of these opportunities, as part of our 2017 investment themes in February (link).

In order to mitigate this news driven emotional roller-coaster, we developed proprietary portfolios, where investors can invest for longer-term consistent gains without involving emotions due to financial news media. For example, we exited the stock market in Sept 2015 and then entered the market again in July 2016, and have maintained long positions since then.

Following is an overview of the performance. Detailed performance will be shared after end of Q1:
  • Conservative: ~7.5%
  • Aggressive: ~18.5%

Want to Invest?

At Understand, Survive and Thrive, our goal is to produce consistent, uncorrelated returns using unique analysis techniques, that will enable your portfolio to beat the market over any economic cycle and provide peace of mind. We don't believe in beating SP500 every single month. And therefore, if someone wants to try our strategies just for the short-term, we will suggest that they will be disappointed at some point.

If you are interested in investing, you can register below and we will send an update. Some of the key outputs from the data models used in this strategy are also available through subscription.

Thursday, March 16, 2017

Next IPM Model Turn Window

After briefly topping at the last turn date of Feb 28, 2017 (link), market rallied yesterday on Federal Reserve's announcement. 

Market Condition

  • During the correction since Feb 28, market did not generate any sell signals. In fact, it generated several buy readings from oversold perspective. 
  • At the same time, Sentiment as subsided in the past few weeks, which will provide fuel for this rally to continue. 
  • From a government perspective, they are busy with controversies and will not be able to influence the market. 
  • Furthermore, Dutch election results were positive for the overall geo-political situation

Hence there are no significant headwinds in front of the stocks right now.

We remain long the stock market because Market Classification Model remains bullish, which turned bullish on stocks in July 2016 and has remained bullish ever since (2017 Investment Performance). However, it is critical to understand potential future turn dates.

According to latest Inflection Point Model re-run, stocks will likely experience turbulence in the first week of April. Following chart shows the IPM model output.
IPM Model turn date is scheduled for April 5 (+/- 4 days). Most likely, this will turn out to be another intermediate top, which will last till majority of companies start reporting their earnings in mid April. However, it will be sufficient enough to make bears out of many longs. 

We will continue to evaluate the market conditions for any sell signals, as we approach this turn date. In the mean time, it seems like this rally could continue for another ~2 weeks.

If your interested in free e-mail list or in paid services like Market Classification Model, please fill-out the form below.

Tuesday, February 7, 2017

2017 Investment Themes

There are many prominent investment themes for 2017. Investment themes help investors understand the broader investment landscape based on historical performance of different asset classes and their current catalysts. This analysis helps in properly positioning one's portfolio to take advantage of the winds of change.

US Stock Market

SP500 and DJIA have experienced an amazing 1 year rally. Since Feb 2016, markets are up ~30%. With such a sharp rally, it won't be wrong to expect a sideways/downward market correction. Since corrections can come in different forms, sideways correction with time will help in digesting last year's gains just like a sharp fall in prices.


Lofty price levels can be supported by equally good earning numbers, which can provide further fuel for the rally. However, with the uncertain political dynamics in the U.S. we should be prepared for any sudden decline in the US stock prices like 1987 market crash - not a certainty but a word of caution.

Note: Next earnings will be reported in mid-April 2017


Emerging Markets

On the other hand, emerging markets finished a 5 year long correction in 2016. As US markets rallied, emerging markets corrected from 2011 to 2015. Since bottoming in 2016, emerging markets have rallied and looks like they have formed an inverted head and shoulders pattern. Once they breakout, emerging markets could go up to there 2011 highs. Therefore, this is an area to keep in mind.


Precious Metals

Gold had been declining since 2013. It bottomed in early 2016 and then rallied sharply. However, since mid-2016, Gold has again experienced a major pullback. However, we think that this pullback is a buying opportunity and would result in higher prices. 

Following chart shows a potential inverted head and shoulders pattern being formed by gold. Once this pattern is complete, gold can make an advance towards all-time highs around 1900. However, the first target would be to reach July 2016 highs. Therefore, gold is an area which one should keep on his/her radar for investment opportunities.


Precious metals are also influenced by the US dollar. US dollar has rallied very significantly over the last two years or so. Therefore, as the US Dollar corrects, it will provide fuel for a rally in the precious metals complex.

Bonds

Bond have been in a long-term bull market. In fact, its one of the biggest bull markets in history of bond prices. However, the bond price cycles are turning and so are the prices. Now the question is whether the Bond Bull has ended or it still has some life left.

Bond prices started declining in mid 2016 and have reached a critical area. Prices should reverse to the upside soon or they will mark the end of the Bond bull, which can be disastrous for the debt-laden global economy. We will keep a tab on the Bond market to understand clues for the future of the US economy.


Investment Options

We are working very hard to make these strategies available for investors. If you are interested in investing, you can register below and we will send you update when the strategy is available for investments. Some of the key outputs from the data models used in this strategy are also available through subscription

Sunday, November 27, 2016

Gold Market Sentiment & Structure Confluence

In the last post we suggested that the trend in the Gold market is about to exhaust itself based on structural analysis (link). Since then the gold declined for a day and helped solidify the pattern, along with pessimism, necessary for a sustainable bounce.


Gold Sentiment
Gold sentiment has dipped to levels last seen near last year's lows. Following snap shots are from Daily Sentiment Index values on Nov 21.


Following chart shows longer-term DSI values (originally published by Taylor Dart). We can see that DSI is at lowest levels seen in last year.
Gold miners are also extremely oversold. They are at levels where we have seen major bounces in the past. This bounce can turn into major rally, dependent on internal market strength.

Hulbert index also shows that the sentiment is now negative 18%, which means that the average newsletter writer is now recommending shorting gold. Even though it is not at the lowest level, we have seen higher lows in the sentiment at the bottom. So it's possible that gold prices might bottom with a little elevated sentiment.


Market Classification Model
Along with all the positive developments on the sentiment front, the Market Classification Model remains in a bull market for Gold. As a result, we should not only expect a bounce but a resumption of the uptrend. This resumption could lead to acceleration to the upside. If the market completes the inverted head and shoulders pattern, we could easily see 1800 in 2017.

In the next blog post, we will discuss Fundamental reasons that could support this rise in Gold prices including asset rotation and Indian decision to restrict currency.

If interested in free e-mail list or in paid services, please fill-out the form below.


Tuesday, November 22, 2016

Gold Market - Approaching a Turn

Gold market has been declining for the past few months. This decline came after a very sharp start of the year rally in Gold. Based on gold market's fundamental, technical and sentiment analysis, Gold is approaching a bottom. From a technical perspective, there are three distinct reasons that point us towards an approaching Gold market bottom:

  1. Intermediate term Gold structure
  2. Longer-term goal structure
  3. Market Classification Model
Intermediate term Gold structure
Gold prices topped in early July. The peak in Gold prices coincided with Brexit panic. Since topping in July, prices have gone down in a choppy manner - characteristic of a market correction.

Even though Gold prices spiked on US election night, they went down and have declined since then. If we look at a slightly longer-term pattern, it seems like that the recent decline is part of a big corrective pattern that started in May. 


As a result, this correction will be wave 2 of the rally that started in Dec 2015. Once this wave ends, we will be in for a very sharp rally in wave 3. This rally will most likelt take the prices to near the all time high. Another evidence in this regard is the inverted head and shoulders pattern being carved out by the precious metal:

Inverted Head and Shoulders
Following chart shows weekly Gold prices over last few years. Once can see a nicely formed inverted head and shoulders forming. Once this pattern is completed, it's target is around 1800 level.


Other reasons to support the fact that Gold is approaching a major bottom is the pervasively negative sentiment as evident from Daily sentiment Index, Bullish Percentage Index or Hulbert Gold Newsletter Index.

Market Classification Model
Our proprietary Market Classification Model remains in a bull market. MCM utilizes prop trend identification algorithm to decipher between bull and bear markets. Currently it is in a Bull market. It entered a Bull in April and has maintained its posture since then. We use MCM to make investment decision and add positions.

In the next blog post, we will review sentiment analysis for Gold and fundamental reasoning for a gold rally.


If interested in free e-mail list or in paid services, please fill-out the form below.


Thursday, September 22, 2016

Federal Reserves and Market Action

The Fed announced holding the rates and provided guidance for potential increases in future. It wasn't anything out of the ordinary. It was highly unlikely for the fed to raise rates at such time before the elections. However, the more interesting reading came from the dot-plot.

Fed uses this plot to provide guidance regarding future interest rate path. Median of the dots show a curve where Fed officials believe interest rates should be over the next few years.

Following chart shows the plot:


Along with the dot plot, above chart also shows the median projections for the next few years as taken in June and September. As one can see these estimates have come down a lot. As a result, the expectation of interest rise have also decline.

Once this expectation declines, it gives was to higher bond prices and lower yield. At this time, higher bond prices would mean more liquidity, thus being favorable for the overall asset class complex. This situation will surely change one day. For now, we are in an uptrend. In yesterday's analysis on Pre Fed and Bank of Japan announcement, we shared same outcomes

Market Classification Model has been bullish on Bonds for years now. And it seems like there is no reason to bail-out on bonds just yet. Even though many financial gurus have been predicting an inevitable bond demise, which will happen one day, current situation is supportive for a bond rally. As long as trend remains up, forecasts for bond collapse will not come to fruition. Therefore, it's imperative that one remains with the trend.

At Understand, Survive and Thrive, we use Market Classification Model to stay aligned with the trend. MCM is an algorithm based on some of the most time-tested market indicators and their inter-relations to determine when the trend changes, so that we don't stay on the wrong side of the trend for long.

If interested in free e-mail list or in paid services, please fill-out the form below.

Tuesday, September 20, 2016

Strategy Performance

Our proprietary model has been performing very well so far this year. Even with recent 2.5 month sideways consolidation, model is up 22.1% vs 6.3% rise in SP500. We will continue to monitor the performance of this model and share updates. This model will be available for investors to replicate or invest in towards the end of the year.


If interested in free e-mail list or in paid services, please fill-out the form below.


Pre-Federal Reserves and BoJ Analysis

Sideways Action Continues

This week, so far, has been as uneventful as prior week. Yesterday, markets opened higher but then sold-off towards the end to close slightly negative. Today, markets closed slightly positive. Since last Monday, market has gone net sideways without any major directional move.

Following chart shows that today we closed at the level where we close on Sept 9th, when the world was coming to an end and DJIA had just declined ~4%


Markets are like a coiled spring. And it seems like the entire world is waiting for the Central Banks. Bank of Japan is going to announce its policy statement early in the morning, while Fed announcement will come at 2 PM.


Bank of Japan and Yen

From Bank of Japan perspective, they would like Yen to decline because that was the catalyst to push Nikkei higher couple of years ago. Right now, Commitment Of Trader data (shown below) shows that the market is ripe for another decline in Yen, which means that its likely Japan will reduce interest rates further or introduce some sort of monetary stimulus.


If BoJ stimulates the market and forces a decline in Yen, we can expect a rally in the indices.


Technology getting ready for a Break-Out

While the US markets have been going sideways, Nasdaq has traced out an inverted head and shoulders near all time highs (shown below):

These highs are 16 years old and there is vacuum above this level. If this pattern holds, we can expect a sharp rally in the near future. This rally can start in parallel with central banks announcements or it can start after a decline following Federal Reserves announcement. In any case, this is a very positive development for the market.

If Nasdaq can lead the market, we can be sure that the overall market will follow and that the recession talk will substantially subside. According to Market Classification Model, we remain in an uptrend. Uptrend typically results in rallies and market participants find reasons to be bullish even in front of negative news.


Strategy Performance

Our proprietary model has been performing very well so far this year. Even with recent 2.5 month sideways consolidation, model is up 22.1% vs 6.3% rise in SP500. We will continue to monitor the performance of this model and share updates. This model will be available for investors to replicate or invest in towards the end of the year.


If interested in free e-mail list or in paid services, please fill-out the form below.


Monday, September 19, 2016

Market Review and Next Week

After a sharp decline on September 9th where Dow dropped almost 400 points, market went sideways last week. Although the net result was sideways action, extreme marker moves were witnessed. Monday opened negative and then markets rallied hard, while Tuesday saw a sharp sell-off.

As the week came to a close, the volatility and market range had reduced. In fact, market closed +0.5% for the week. Following chart shows gyrating market behavior of last week.


While SP500 and DJIA consolidated towards the bottom of the range, Nasdaq 100 powered to near all-time highs, primarily driven by Apple stock and the demand for the new iphone and Samsung issues. QQQ are now very close to all-time highs!


One thing that we have said many times on this blog is that the market trend determines how the market participants and investors react to headlines. This weekend there were many reasons to sell the market, ranging from bomb blast in NYC to other events in Syria (US and Russia tension). However, if we are in an uptrend all headlines will be interpreted in a positive manner and resolve to the upside.

According to Market Classification Model, stocks remain in an uptrend. And that's the reason why we have neither sold our stock positions nor are planning to sell them till the model turn south. At this point, it will take a sustained substantial decline to do so. However, past week's decline has created enough selling extreme without really damaging the internal structure, that one can treat it as a minor correction in an uptrend.

Next Week
In the coming week, there are many reasons stories that could move the market. Top two news events will be:

  1. Fed FOMC meeting
  2. Bank of Japan meeting
It's very interesting that Fed and BOJ announcements will come one day before Fall Equinox on Sept 22nd. 

Investment Actions
Staying long in stocks and ignoring news based market gyrations would be two of the most important things one can do. If the market declines, it will provide an even better buying opportunity. But it's possible that the market rallies for next 1-2 days, followed by a decline after Fed announcement, which is quickly reversed. 

In other words, there will be a lot of back and forth, and one should not get caught in such gyrations. Instead, its paramount to remain focused becaus ethat's how you can become successful in the long-term.

If interested in free e-mail list or in paid services, please fill-out the form below.

Wednesday, April 27, 2016

Benefits of Model - Part 3

With Federal Reserves not raising the interest rates and Bank of Japan maintaining negative interest rates, the markets are primed for some interesting action. At this point, one must ask:
  • Why is the Fed so uncertain? 
  • What are they seeing that even with stock market (SP500 and DJIA) near all time highs, they are not willing to increase the rates?


We know that the economy is not very strong. And it is a good decision from the Fed to not raise rates. However, what type of signal will it send to the investors? Is it time to be wary of the stocks as the economy struggles or is it time to get aggressive?

The question then becomes, even though the Fed has maintained the interest rates for now, how long can they maintain this posture? Will they not increase the rates on the first sign of strengthening economy? In that case, if the May jobs report comes in very strong, which is expected based on last week's extra-ordinarily strong weekly claims data, will that push Fed over the edge to raising rates at June's meeting?

In short, there are so many questions on the fundamental side. Similarly, from a technical perspective there are also several questions. At this time, the best strategy for any individual could be to stay out of the market and wait for the market to show its true direction, which could result in a delayed entry into a good long/short position. Or follow a system that takes out emotion from the investments. Since we have been using the Portfolio Enhancement Algorithm since the start of 2016, we decided to analyze the Q1' 2016 performance.

In the last few blog posts, we have discussed the benefits of Portfolio Enhancement Algorithm based in 2016 based on real-time performance with real money (as of April 12th, model was up ~9%, while SP500 total return index was up ~2.5%. 
Following are some additional benefits that we realized by using the model during Q1' 2016.
5. Trend/Momentum following ability

Model offers the ability to utilize two of the most basic concepts of investments that help investors in the long run. In fact, hedge funds, which made a lot of money in 2015, were momentum following hedge funds. These funds realized that oil price decline had strong momentum and therefore, continued to hold short positions in oil.

As long as one can stay with the trend, investments pay off in the long run. My 8 years of experience in the financial industry has confirmed the adage that "Trend is your Friend." If a person tries to fight the trend, it’s possible that he might make few good trades but in the long-run the investment account will suffer. 

Although there are indicators and analysis techniques that allow a person to identify potential areas of trend changes and market timing, there is no Holy Grail. Therefore, the best option for investors is to stay with the trend. While staying with the trend, it’s imperative to have risk management facets to guide one about potential upcoming changes in the market structure.

This is similar to regular health checks that one undergoes to see how a person is doing internally. If one doesn't do health checks, they won't get a forecast of what is going on inside his/her body. As a result, it can be too late when one reacts to the new developments. In order to mitigate such risks in the investment world, this model has in-built risk management and market health check mechanisms.

6. Positioning for Next Market Move 

Another key aspect related to risk management and market health check is the ability of the model to position for the upcoming move in the appropriate area. It’s always critical to position one's portfolio before a move happens rather than reacting after a move has started. This not only reduces the stress, but allows one to establish a good position

Since majority of portfolio gains occur at the start of a new rally phase, if a person waits for the rally to begin, they might miss on the lion share of the move. On the other hand, if a person enters too early they might sell before the move actually starts. As a result, it’s always critical to correctly position the portfolio for next moves and have confidence in the allocation.

This is another huge benefit of this model that it allows us to position the portfolio for an upcoming move without taking too much risk and ensuring enough diversification with risk management perimeters. As a result of these benefits, this model can be applied in any portfolio and can be used with leverage to compound returns.

As an example, the model allowed us to position in such a way that we benefited from the Jan/Feb 2016 market decline and then allowed us to mitigate losses through accurate positioning in March, followed by sharp gains during the last week of March and first week of April.

  • Buy and Hold features
  • Quantitative benefits:
    • Beta
    • Sharpe Ratio
    • Alpha

Monday, February 8, 2016

Employment Numbers, Economy and Market

Economy continues to perform below expectations. Latest job numbers were OK but not GREAT. I don't think they are even good enough to justify future rate hikes. But unfortunately Federal Reserves is locked into this situation where they have already committed several rate hikes for 2016. Although they won't do four hikes in 2016, any hikes will result in a flattening yield curve and possibly lead to negative yield curve.

Yield curve inversion typically leads to a recession. Although the numbers are not showing eminent recession right now, the stock market is now surely discounting a significant slowdown in economic activity. If the economy is to enter a recession, we could see further losses in the market.

From a socioeconomic perspective, a recession/bear market in the final year of election, could pave the path for a socialist president in the form of Bernie Sanders because people will be angry towards capitalists.

Getting back to economy, industrial activity has slowed considerably, which is an indication that the manufacturing sector is already in a recession. Number of job cuts being announced reminds us of the days of the great recession, when the news was always about reduction in workforce. When you have job-cuts coupled with tightening Fed policy, restricting the money flow, it just exacerbates the economic situations.

In fact, it leads the economy into a death spiral where one negative news feeds the other negative thing and so the cycle continues. For example, reduction in jobs will result in lower spending, which will in turn reduce profits, resulting in lower stock prices and cost-cutting measures, which will result in more job-cuts.

Under these circumstances, stock market is tracing out a series of mini-head and shoulders patterns. As you know head and shoulders pattern are topping formation. These patterns also appear in a downtrend as continuation patterns. Following chart shows H&S pattern in SP500.


If market declines in the next few days, this pattern will be broken and January lows will be tested. This will allow the market to complete the right shoulder of a longer-term head and shoulders pattern (discussed here)

Under these circumstances, the best option is to stay out of the market and wait for a trend change before going long again. Bonds remain in a bull market, so they can be a good place to park cash and ride-out this rough patch in the stocks, which could last for the next few quarters (at least).

Tuesday, February 2, 2016

Downtrend Continues

Market resumed its decline in a major way today. More interesting than the decline was the muted reaction from the traders, as VIX did not spike. If fear doesn't spike with declines, it means that we have further decline ahead.

Market rallied last week but got way over-bought in just few days. In fact, a sell signal was generated on Friday. That sell signal resulted in decline yesterday from which the market initially recovered. However, it was too much weight for the market to carry. As a result, it gave way to serious selling today.

We have been maintaining that the stock market's inherent structure changed last year in August, and suggested a move to cash. Proprietary portfolio allocation model allowed us to diversify between bonds and short stocks. This portfolio has been performing very well so far this year (link). It is up +6.7% this year, while SP500 is down 6.7% this year. We will talk about latest results in the next post. Right mow, let's look at the structure of the market.

Nasdaq along with many other indices, is tracing out another head and shoulders pattern. This pattern is larger in magnitude than the prior pattern, and could result in substantial decline.


Over the next few days, market will fill the right shoulder of this pattern. Once right shoulder is filled and market breaks below the neck-line, significant decline can be in the offering.

Head and Shoulders are reversal patterns, and when you see a cluster of these patterns, as shown above, they become even more important. Overall, it means that the trend of the last 7 years has ended and we have entered a bear market. This would mean that the economy will slow down and we might see additional bad news coming from different market segments. Oil was the initial catalyst but now we could see other areas hurting.

However, many people are just realizing this new development and others are still oblivious to a market decline. But we prepared for this potential scenario and now are waiting for the downtrend to unfold over the next few months. Bonds remain in a bull market, as yields continue to decline.


Friday, January 15, 2016

Bonds Bull is Roaring

We have been discussing stock market's #Bear and Bond market's #Bull for a while. Now it seems like Bond market is really taking-off. This is evident from a sharp rally in the bonds over the last 2 weeks. Some might attribute it to the declining stock market but a bull market keeps on rising and people find reasons for the rise.

As a confirmation of the trend, bond prices have just completed an inverted Head and Shoulders pattern (shown below):


We have been discussing this pattern since December, as following charts was published here on December 21.


As bonds rally and stocks decline, we are short stocks and long bonds. Being long bonds gives us cash flow in form of dividends and being short stocks allows us to take advantage of the downside.

Like any market, this bond rally will come across obstacles but the constant cash flow and the diversification provided by this investment is invaluable, along with the potential for capital gains. At the same time, it will provide a very good opportunity and probably the last opportunity for people to buy homes at very low interest rates.

As market gets more volatile, it will even make more sense to invest in bonds. But the good time to invest in any asset class or stock is before the major move happens and the news becomes public. Let's see when the stock market bounce happens, which might provide added insight into the long-term (6 months to 1 year) market trajectory.

After all is said and done, there will be a very good opportunity to buy stocks down the road.


Wednesday, January 6, 2016

Long Term View of Dow Jones Industrial - $DJIA

Markets continued their decline and are again poised for a down day with China closing early due to circuit breakers being activated for the day.

We have been talking about the stock market trend change since September 2015 in the following blog posts:
  1. New Year and the Stock Market
  2. Bonds Rally Analysis and Stocks
  3. Importance of objectivity in trend following
  4. Current Market - Bear Case Evaluation
  5. Investment Optimization Model (IOM) Performance - August 2015

At the same time we have been discussing markets via twitter on a more frequent basis. In this post, I would like to analyze the market from a long-term perspective. Chart below shows the performance of Dow Jones Industrial Average over the past 2 decades. 


Following are the key highlights evident from the above chart:

  1. US stock market remained in a sideways phase for over a decade
  2. US stock market broke above the resistance level in 2012. This break was more pronounced in SP500
  3. Rounding top/Head and Shoulders top formations took place at the two prior tops. And currently, it seems like a similar pattern is being formed
  4. There is a longer-term trend line which the market failed to break to the upside, and might have capped this bull-market
  5. Since the economy lags the stock market by ~6 months, we can start seeing the impact of lower oil prices through energy sector decline in the economy, starting in Q3'16
  6. If the market has really topped, we can expect ~7+ months of decline to correct last ~7 years of rally (if we are not in a secular bear market)
  7. Decline in earnings will result in higher P/E ratio. As a result, stock prices might come down to bring the P/E ratio to normal or lower valuations
  8. Many of the individuals components of $DJIA are tracing out individual Head and Shoulder patterns, which could mean that the market's components are broken
  9. Best case scenario for this correction would be to end before breaching below 2011 lows
  10. Worst case scenario would be a break below 2009 lows and formation of an expanded traingle pattern, similar to 1970s bear market but a larger scale
In short, current market decline should be looked at with caution. Until and unless the model confirms a bull market, we will not enter long. Algorithm has been long bonds for a while and went short on stocks on Jan 1st. Aggressive portfolio is long other assets based on proprietary asset allocation mechanism.

At UST we have now dealt with short-term trading based on IPM trading model and longer-term investment based on Investment Optimization Model. We will continue to share our insights with readers. For now be careful. We will go long, as soon as the model goes long.