Twitter

Showing posts with label Stock Trading. Show all posts

Tuesday, October 25, 2016

Inflection Point Model - Performance Recap

Inflection Point Model predicted a market turn date on Oct 21, 2016. Market declined on the 21st and then rallied. The rally continued today and futures are up now. With new catalyst along the way in the form of earnings from Apple and Google, we can expect more gains. Good thing is that even with today's very powerful rally, there was no sell signal. This suggests that the trend remains intact and is strong.

IPM Output - Turn date 10/21/16
Following chart shows the IPM model's output, as shared on Oct 17th (link)
Market Structure
Analyzing IPM model in conjunction with the market structure showed us that the trend had been sideways to down since mid July. Hence, the likely scenario was for market to put in a bottom during the IPM turn window and rally.

Following chart shows the latest structure shared on the blog along with a blue box, highlighting potential market turn window.


Following chart shows performance of SP500 as of today i.e. after bottoming within IPM turn window on Oct 21, one can observe the green bar with a gap up. Today's performance shows that the market gaped-up but did not cover the gap, hence, hinting towards a strong move. At the same time, confusing so many market participants, who have been taking failure of rallies as the new norm. 


Next Steps
We will continue to evaluate the market with respect to its structure and Inflection Point Model. One of the biggest benefits of the IPM model is to forecast potential market turn dates. And when IPM turn dates are combined with Market Classification Modal, it paints a much clearer picture. 

Market Classification Model is bullish. Next run of the model will be in next few days. Once the model is processed, it will tell us whether the internal strength of the market justifies a continued bullish posture or should one be wary of market trend changes. This information will be shared with subscribers immediately, so that they may evaluate their long investment positions.

Tomorrow's market Action
So far the futures are up and we could see a  continuation of the rally. This rally has a lot going for it but there are some signs of tiredness appearing in the market. We will evaluate the market structure and next IPM turn window in upcoming posts.

If interested in free e-mail list or in paid services, please fill-out the form below.

Saturday, October 22, 2016

Sideways Gyration Continues...

For more than 3 months markets have been going sideways. This sideways action is not only boring, its very straining for investors, economists and everyone else. As market goes sideways, investments don't yield returns which frustrate investors and they try to do things that more often than not hurt them. It's a way of market to throw us off our investment strategy. But the goal is to be not be dissuaded by the market and keep following a plan.

Along side regular investors, it significantly impacts options traders. Sideways market action is disastrous for option premium. As a result, options expire worthless. SP500 is currently at the same level as it was in early July. So over last 3 months, market has not gone any where.


If anything, it has a slightly downward trajectory since August. On one hand, this kind of market action is positive for long-term market gains, as market is digesting gains and will most likely breakout, it begs the questions whether we have seen the bottom or market still needs to do some work on the downside.

We are blessed to be up ~20% (YTD), while SP500 is up ~6%. Detailed performance analysis will be shared at the end of the month.

Identifying Next Market Move
Identifying a top or bottom remains a very difficult job. In order to correctly project market's next move, we need to take into account 4 items:
  1. Timing
  2. Structure
  3. Market Signal
  4. Confirmation
Without all of the above items lining-up, its premature to assume that trend has reversed.

Timing
In regards with market timing, we are currently within the Inflection Point Model's turn window. Window is shown above in blue box and is shown below:
Turn window will expire at the end of next week.

Structure
Market structure remains corrective but there is a potential that we can see a decline before sustainable rally. Therefore, if the market rallies and can sustain the rally, it will be signal of bottom. If the market cannot sustain the rally and starts declining in the next couple of days, it will suggest more work is needed on downside. 

Market Signal
If market performance over the next few days generates a technical signal, it will show us whether market will top or bottom within this turn window

Confirmation
Once the trend is set, we would need a confirmation by proprietary levels to confirm the move.

Conclusion
Market remains in a sideways pattern. This pattern will soon end but will confuse many market participants along the way. At UST, we know that the market is within a turn window, now we just need to wait for a market signal and confirmation to confirm the next move. 

Overall, market remains in an uptrend. And in the next post we will see the value of adhering to Market Classification Model. We will also be writing a series of posts on how our proprietary strategy fared in a confusing sideways market. This will be an amazing case study and I am thankful for the fact that we have seen this kind of market action because it will enable us to see the benefits of certain key aspects of our strategies.

If interested in free e-mail list or in paid services like Market Classification Model, IPM or others, please fill-out the form below.

Monday, February 8, 2016

Employment Numbers, Economy and Market

Economy continues to perform below expectations. Latest job numbers were OK but not GREAT. I don't think they are even good enough to justify future rate hikes. But unfortunately Federal Reserves is locked into this situation where they have already committed several rate hikes for 2016. Although they won't do four hikes in 2016, any hikes will result in a flattening yield curve and possibly lead to negative yield curve.

Yield curve inversion typically leads to a recession. Although the numbers are not showing eminent recession right now, the stock market is now surely discounting a significant slowdown in economic activity. If the economy is to enter a recession, we could see further losses in the market.

From a socioeconomic perspective, a recession/bear market in the final year of election, could pave the path for a socialist president in the form of Bernie Sanders because people will be angry towards capitalists.

Getting back to economy, industrial activity has slowed considerably, which is an indication that the manufacturing sector is already in a recession. Number of job cuts being announced reminds us of the days of the great recession, when the news was always about reduction in workforce. When you have job-cuts coupled with tightening Fed policy, restricting the money flow, it just exacerbates the economic situations.

In fact, it leads the economy into a death spiral where one negative news feeds the other negative thing and so the cycle continues. For example, reduction in jobs will result in lower spending, which will in turn reduce profits, resulting in lower stock prices and cost-cutting measures, which will result in more job-cuts.

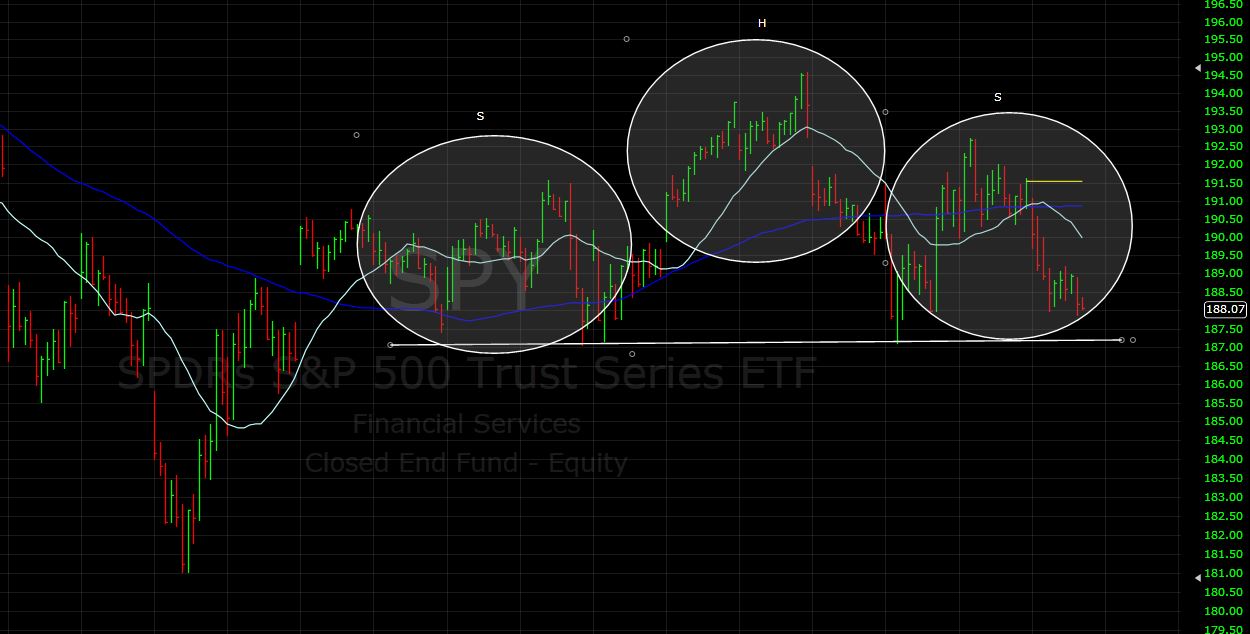
Under these circumstances, stock market is tracing out a series of mini-head and shoulders patterns. As you know head and shoulders pattern are topping formation. These patterns also appear in a downtrend as continuation patterns. Following chart shows H&S pattern in SP500.


If market declines in the next few days, this pattern will be broken and January lows will be tested. This will allow the market to complete the right shoulder of a longer-term head and shoulders pattern (discussed here)

Under these circumstances, the best option is to stay out of the market and wait for a trend change before going long again. Bonds remain in a bull market, so they can be a good place to park cash and ride-out this rough patch in the stocks, which could last for the next few quarters (at least).

Friday, January 15, 2016

Bonds Bull is Roaring

We have been discussing stock market's #Bear and Bond market's #Bull for a while. Now it seems like Bond market is really taking-off. This is evident from a sharp rally in the bonds over the last 2 weeks. Some might attribute it to the declining stock market but a bull market keeps on rising and people find reasons for the rise.

As a confirmation of the trend, bond prices have just completed an inverted Head and Shoulders pattern (shown below):


We have been discussing this pattern since December, as following charts was published here on December 21.


As bonds rally and stocks decline, we are short stocks and long bonds. Being long bonds gives us cash flow in form of dividends and being short stocks allows us to take advantage of the downside.

Like any market, this bond rally will come across obstacles but the constant cash flow and the diversification provided by this investment is invaluable, along with the potential for capital gains. At the same time, it will provide a very good opportunity and probably the last opportunity for people to buy homes at very low interest rates.

As market gets more volatile, it will even make more sense to invest in bonds. But the good time to invest in any asset class or stock is before the major move happens and the news becomes public. Let's see when the stock market bounce happens, which might provide added insight into the long-term (6 months to 1 year) market trajectory.

After all is said and done, there will be a very good opportunity to buy stocks down the road.


Monday, January 4, 2016

New Year and the Stock Market

Happy New Year. Although today is the first trading day of the year, markets opened at negative 300. From a such a negative opening its very hard to make a come back and close in the positive territory. And market declines on the first day of the year, odds of a losing year are at 50% based on historical data (link).  

At Understand, Survive and Thrive, we suggested that the market has undergone a trend change back in September (link).  However, we suggested that shorting opportunity is not here, and we should wait for a market rally. Experience shows that markets rally after a sharp decline for two reasons:

  1. To entice weak hands into the market as buying opportunity
  2. To shake shorts who were early to the game
Once the mood changes, markets start their decline phase, which is persistent. At this point, the possibility of a prolonged decline has increased sharply. In fact, several of the high fliers like MSFT, NetFlix and others are down big today, which shows that the leadership is now leaving the market.

This is also evident from the structural integrity of the market. Stock market patterns can provide very valuable insights into the performance of a particular stock or the over all market. We discussed in December (link) that the market is tracing out a Head and Shoulders pattern, which symbolizes potential trend changes. That pattern is still in plan. But now another Head and Shoulders pattern is visible in Nasdaq (shown below).


Once this pattern is completed, which is almost complete, we can see a sharp sell-off to the downside. This could take the prices down to prior base level i.e. potential 6%+ decline from current levels.

One might ask what can cause such a decline. Although there are many reasons that we will read in the news for today's decline, earnings will be the primary driver, which start in 2 weeks. As economy weakens, earnings will dwindle and stock market will follow. So in the situation what an investor must do?

Following are some of the strategies that we are applying to navigate through this situations:
  1. Invest in assets that are in bull markets (Bonds)
  2. Exit longs from stocks
  3. Short indexed ETFs with predefined mix of diversified assets and risk mitigation startegies
  4. Keep powder dry for upcoming bull markets in other asset classes
 

Tuesday, February 4, 2014

IPM Trade Matrix - Trade 4 (Part 3)

IPM Trade Matrix Trades

TRADE - 1: (Long) = +2.6%
TRADE - 2: (Short) = +9.3%
TRADE - 3: (Long) - Non IPM Trade Matrix trade = -0.2%

TRADE - 4: Short - Still holding short since 1/31/14
Long TZA (short ETF) at 18.23 ==> 18.57 (shorts added) 
Short positions were added on 1/31/14, 2/3/14 and 2/4/14 based on Elliott Wave structure and break below critical levels. 

TRADE CONDITIONS
Condition: Outside IPM Turn Window (Re-entry)
Trigger: Test of ~1785 (SP500) and decline below 1769 (SP500). Decline trigger was based on EW analysis and other proprietary levels. 
Supporting Indicators:  Initial decline was impulsive (5-wave). Next IPM window is a Bottom and is 1-2 weeks away. Details of IPM turn window e-mailed to subscribers. 

PROFIT TARGETS
Profit Target 1: 1725 - 1730
Profit Target 2: 1670 

RISK
Stop: Above 1770
Trailing Stops: 1770 - Based on Elliott Wave analysis (will be updated on a regular basis)
Typical IPM Trade Matrix Risk: 1.5%
Actual IPM Trade Matrix Risk: 0% (Entry = 1785, Exit = 1770, Risk = No Risk)
Risk Reason: No significant risk because upcoming turn date is a bottom.

Applicable Rule: Do not go long or short without trigger to prevent losses by market moving against you.  


Note: IPM Trade Matrix Trades will be posted in the first half of 2014. This is an experiment to understand and enhance the capabilities of this Matrix.