Twitter

Thursday, June 18, 2015

Model Performance Review

Performance Review

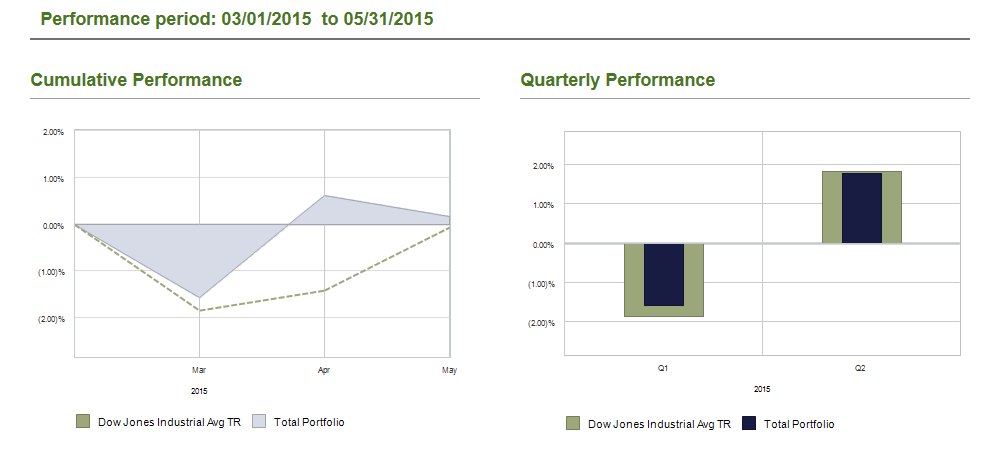
DJIA (since March 1, 2015) = -1.06%
SP500 - Total Return (since March 1, 2015) = +0.46%
Model (since March 1, 2015) = +1.97%
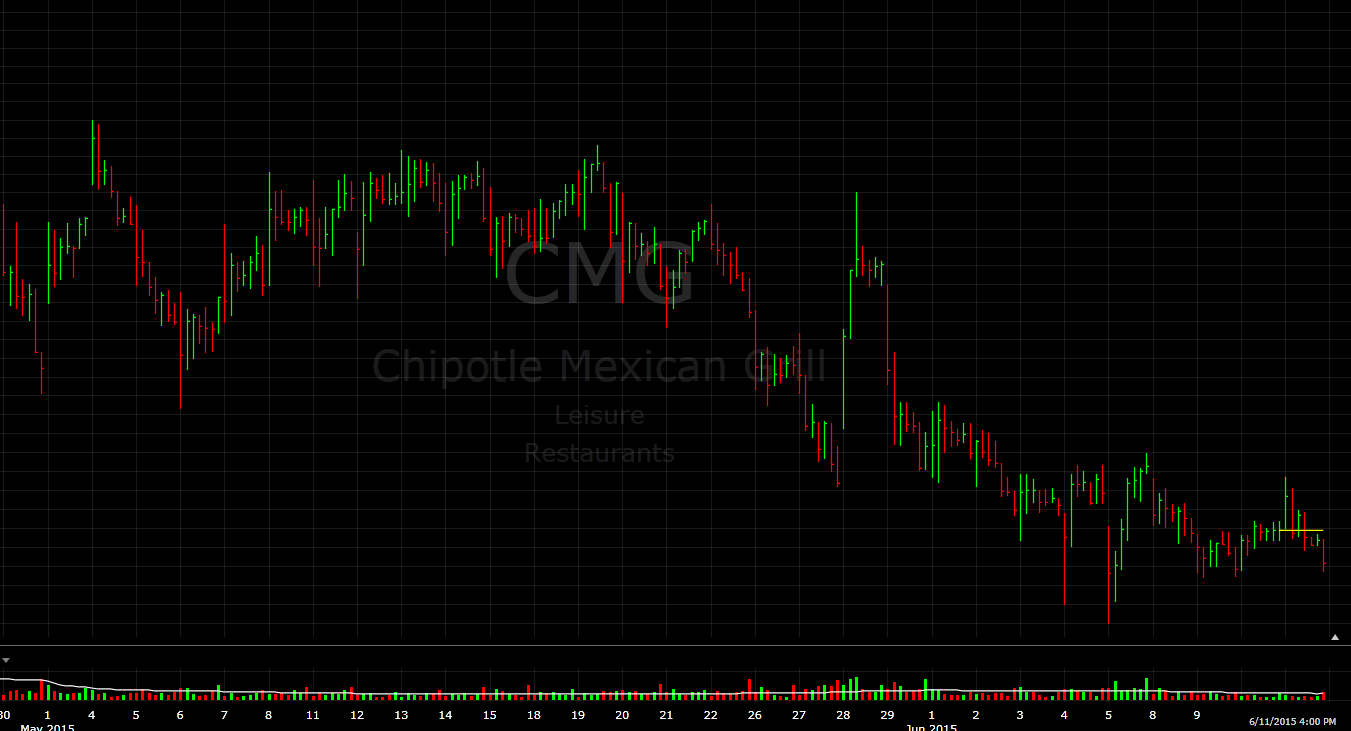
With model outperforming the market handsomely over the last 3.5 months and in a directionless market, it seems like it has added significant value. The best part is that the model has inbuilt risk-mitigation mechanisms, which ensure that no single stock gets extra weightage and any stock which enters its respective bear market territory, is removed from portfolio.

The best example in this regard is the removal of Chipotle from the portfolio and addition of Krispy Kreme, which rallies sharply.

In the mean time, UST team has been analyzing the model using strict stress testing mechanisms and we will share our findings on the blog.
 

Friday, June 12, 2015

Removing $CMG & Adding $KKD

Markets have rallied, as anticipated. Sideways action since the start of this year has laid the foundation for strong move. Once the market moves out of current range, we can experience acceleration to the upside. However, the extent and longevity of acceleration is anyone's guess. That is exactly why, one needs to follow a system for investing and trading.

Investors with a unique, easy to follow but comprehensive strategy can make constant income in the stock market without taking huge risks. However, the more one risks, the more are the potential gains. Therefore, it again depends on one's risk appetite. At Understand Survive and Thrive, we have developed a short-term and a long-term trading/investing model.

Short-term model involved a lot of volatility with strict risk management. Whereas, long-term model, manages risk effectively and also generates excellent without continuous stock market monitoring. This model generated a sell signal on Chipotle at the beginning of June and generated a buy signal for Krispy Kreme at the same time.

As with any algorithmic system, trade has to be taken when it is generated without any question. As a result, Chipotle stock was sold and the position was closed in the portfolio. At the same time, Krispy Kreme shares were added to the portfolio.

As of today, $CMG has gone further down (shown below).


Whereas, $KKD has rallied sharply on an upbeat earnings report.


Similar situation happened with Amazon in January and other stocks over the past few months. So far, model portfolio has outperformed a sideways to down market since March 2015, with a very impressive margin (by the grace of God):

DJIA (since March 1, 2015) = -0.73%
Model (since March 1, 2015) = +1.88%

The best part is that the portfolio analysis and trading times are minimal. Consequently, minimal stress with impressive risk-management.

In the next post, we will talk about how do fundamentals stack up for Chipotle and why has it gone down.

Sunday, June 7, 2015

May Market Review and Model's Performance

May was a rough and volatile month for the markets. It was marked by uncertainty and a volatile bond market. Investors were freaked-out by the poor economic numbers of the first quarter, along with poor indicators like housing starts etc. At the same time, the bond market was undergoing very sharp swings, highlighting the angst bond investors were experiencing in the face of upcoming rate hike by the Federal Reserves.

Rate increase by the FED will cause the rates to increase across the entire spectrum. As we know, rate increase results in a decrease in value, which would result in huge market losses for bond investors. In order to avoid such losses, many investors were rushing to the exit.

May's choppy market action is showcased by the following chart, which shows DJIA over the month of May. As you can see the market saw wild swings but overall rise was minimal.


At the end of the month, DJIA managed to gain slightly more than 1%. However, the model portfolio lost 0.4%. Since the model's goal is to generate results in any market, May's under performance was an anomaly. So far the model portfolio has beaten the market since November 2014.

Following chart shows model's performance since March 1, 2015. We have selected March 1st because at the start of March, full account was invested per the algorithm .Therefore, this will give us the best understanding of the performance.


As mentioned before we will keep tracking the model on a monthly basis to highlight its value. Please note that the goal of the model is to beat the market by managing risk, following trend and balancing portfolio using proprietary algorithm. The model undergoes trades once a month and rest of the month there is no change to the holdings.

One of the holdings that was removed form the portfolio this month was Chipotle ($CMG). We will discuss Chipotle in greater detail in the next post.