Twitter

Monday, October 16, 2017

Q3' 2017 Performance Review

2017 has been a very eventful year. Through September, SP500 has rallied more than 14% with dividends, even with many uncertainties like geo-politics, environmental upheavals, and rising interest rates. In fact, SP500 has defied gravity, as if there is nothing like gravity of resistance, bemusing many market watchers who have been expecting a pause for quite some time now. Hence, it has been a difficult period for investors as they have to absorb a lot of headline risk and be brave in their investments. 

During these testing times, both of our proprietary strategies have performed very well. Since the very beginning, our goal is not just to beat SP500 but to generate value for investors in following 4 ways:
  1. Consistent returns comparable to major stock market indices
  2. Uncorrelated performance - Deliver Alpha under any market condition
  3. Differentiate by deploying techniques not used by mainstream investment gurus
  4. Provide a unique perspective to markets.
Performance Summary (excludes fees)

Although we plan to review 2017 performance in greater detail over next few weeks, let's quickly review the circumstances that have made 2017 unique. 

Market Recap
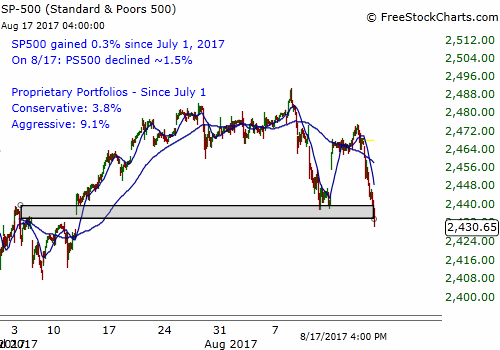
2017 started with an overbought market, which continued to rally into March followed by a 1.5 month decline. At the time, many reasons were given for this decline including overbought market, high valuations, sentiment, potential for unfulfilled presidential promises and geo-political turmoil. However, market resumed its rally with Q2 earnings in April. 

Market rally continued in May through early June. At the same time, we saw excessive optimism from famous investors calling tech stocks extremely cheap. As Fed raised rates in June market took a brief breather. This pause was accompanied by calls of '3 hops and a tumble' on Fed rates' influence on the markets. But with earning in July, market resumed it's ascent. 

Everyone should ask themselves if their portfolio is positioned to absorb increased volatility because it will come eventually. And not only absorb volatility but take advantage from it. 

In order to properly and profitably navigate through markets where extreme gyrations and news driven moves are the norm, one needs to maintain composure. Our strategies don't depend on market news, rather take into account underlying market tones to make investment decisions. This reduces transaction cost, dampens volatility, moves taxes to long-term bucket and generate consistent results for long-term benefits.

Portfolio Strategies
We currently have two live strategies, and are working on 3 more strategies in Beta phase. Goal for both of these strategies is to generate absolute, uncorrelated returns: 
  • Conservative (EPSB): Suitable for retirement accounts and risk-averse investors
  • Aggressive (AEPSB): Suitable for risk taking investors, with longer-term invest goals
Although past performance doesn't guarantee future results, 2017 performance through Q3 was very good for both strategies. June was the first negative month after 6 positive months, providing a much needed correction to avoid over-heating. And with September's decline, we are now within the buy range, which means that we are prepared for a significant rally phase in the next quarter or so.

Note: Following strategy performance numbers do not include fees.

Conservative Strategy: 13.5% vs 14.2% for SP500 (w/ dividends)
Through Q3 2017, Conservative strategy performed similar to SP500. Keep in mind that SP500 has had a very good year so far, with it being up ~14%. But the better part is that since inception in Jan 2016, R-sq correlation coefficient is 0.07 with respect to SP500. 

Aggressive Strategy: 33.7% vs 14.2% for SP500 (with dividends)
Aggressive strategy has performed very well in 2017. And the R-sq correlation coefficient is 0.01. In other words, our performance is not dependent on how the stock market performs.


Conclusion
The best aspect of these strategies is that they enables the investor to concentrate on the work that is more important in life than losing sleep over investments through daily news because we do the research and invest using proprietary algorithms and valuation models.

These strategies are open for investment. Please feel free to contact via subscription.ust@gmail.com for details. These strategies are being implemented via managed account setup through a Registered Investment Adviser. As a result, you keep control over your assets. 

Please contact us for details. You can also sign-up for free email updates below: 

Friday, August 25, 2017

Market at Crossroad & Potential Catalysts

Over the past few weeks, we are seeing several consolidation patterns popping-up in different markets. Consolidation usually signals in-decision or brief pause before resumption of the underlying trend. However, markets also consolidate in a sequence of 1s and 2s before a significant move in a new direction.

It appears like we are experiencing both the cases in different areas, where market is tracing out a sequence of 1s and 2s, and is waiting for a catalyst to break out of this consolidation. Following charts show this pattern:

Bonds: Since July Bond prices have been increasing but in an overlapping manner. This suggests that either this is a corrective move and we will see a move down soon, or we will soon see above June highs.


Gold: Over the past 4 days, Gold has placed in 4 inside days above the downtrend line and near the resistance. Inside days show indecision - a point where buyers and sellers are not comfortable making the move. Although most of sideways consolidations result in a move in the direction of the trends, next few days will be telling in terms of the move.


Stocks: SP500 is stair stepping down. Like other instruments, this stair-step pattern would either give way to a substantial decline in the near future or would turn out to be a correction in the broader up trend.

Even though stock market sentiment has come down recently, it remains elevated. On the other hand sentiment for Bonds and Gold is rising but not very optimistic yet. Proprietary timing indicators suggest that next turn date is few weeks away in the stock market. Therefore, if the market declines, other assets could rally but they need a catalyst to move away from current sideways indecision.

Need for Catalyst
Today's Jackson Hole speeches by Janet Yellen (Fed Chair) and Mario Draghi (Chair ECB) could be the catalyst that the market is waiting for.

If it is the trigger and if the markets start moving in 3rd wave out of this consolidation, logical move would be a rally in Gold and Bonds, while decline in Stock Market. Stock market is over-valued and has been rising for over a year, so this move is very possible. A decline in the stocks will be attributed to debt-ceiling debate and numerous other distractions from Washington by fundamental analysis but essentially it will be a natural part of the market rhythm.

We have underscored this observation multiple times that financial news media distracts investors. It can lead to early exit and pre-mature entry into investment positions. As a result, one of the lessons that we learned through 2016 is (Investing Lessons)

Lesson 1: There are no guarantees but being persistent is the key to long-term success

Long-term investing is regarded as the secret ingredient for many successful investors. Time is a very powerful commodity. If you give time to a successful business model or investing strategy, and combine it with dedicated and passionate management team, it will give you amazing long-term results.

Another reason why long-term returns are much more important than short-term returns is because when a portfolio achieve critical mass, one’s personal savings will not have that big an impact on the growth of portfolio. For example: $100K invested today will grow to 1M @ 20% return in ~13 years. At that point 100K will not have as much value because @20% / year an investor will experience a $200K increase without adding any more funds.

Thirdly, investing is a game of nerves and patience, whether in the stock market or any other endeavor like small business, start-ups through Angel/Venture investing, or Private Equity. The only difference with stock market based investing is that you have the opportunity to exit early because the market provides excessive liquidity, which provides peace of mind for many investors.

Long-term investment positioning and persistence provides investor with the focus needed to successfully withstand periods of draw-down because major moves take place after big draw-down periods. We will discuss additional lessons in the next post.

How to Position? 
Most of the readers would agree that the markets are at a critical juncture. However, knowing this is one thing and acting on this information is totally different. So far in 2017, we have mentioned several big moves on this blog and on twitter but doubt if effective trading was performed around this analysis by the readers.

Effective, long-term and consistent trading requires discipline and an edge in the market to adjust findings as market situations change. At this critical time, we are using proprietary models to expose clients to positions that have the highest success probability.  Performance - H1 2017 

Contact
  • Any investment / trading questions: Twitter (@survive_thrive)
  • Free e-mails or Investing: Click on the button below 

Friday, August 18, 2017

Current Market Volatility and Lessons from 2016

Summary
  • Overview of July / August market action
  • Performance milestone of Investment Strategies
  • Lessons learned from 2016 draw-down and positioning for effective investing

Recent Market Action
Yesterday we saw a significant downdraft in the markets with SP500 down over 1.5%, while Nasdaq was down ~2%. Although this kind of behavior is nothing new for market watchers who remember 2008, it was a surprise for many who had forgotten that volatility can even rise. And not only rise, but bite very hard.

Although 2% decline in one session is good for some investors - those who are looking for cheaper stocks or are short the market, it is very scary for other market participants who are long stocks. These are the type of market conditions (volatile and uncertain), where a "Market Neutral, Absolute Return" strategy shines out among many other options.

Such strategy when combined with algorithmic rigor and proprietary indicators can not only give you peace of mind during down turns, it positions your portfolio for significant rallies. Following chart shows SP500 since the beginning of July 2017. It is evident that SP500 went sideways for over 1.5 months (+0.3%), while our portfolio strategies performed very well (Up 3.8% and 9.1% excluding fees).

Disclaimer: Performance numbers do not include fees and past performance doesn't guarantee future results
Historical Perspective
Overall, it has been a very interesting year with a rising global stock markets. However, riding the rising market has not been easy because of constant uncertainty. On one hand, financial media pundits highlighted that the equity markets are over-extended and one should prepare for a potential decline, while on the other side, they kept recommending staying long and buying in the market because of multitude of reasons. As a result, it became very difficult for a regular investor to invest in the market - let alone the volatility that we are experiencing right now. 

Although this makes things difficult, the good news is that this is nothing new and hence can prepare us for the future. Markets, financial pundits and media always behave like this. I have seen this over past 9 years of writing about the markets, and through the history of the financial markets whether in 1929, 1960s, 1980s, 1990s or 2000s.

In order to counter this continuous propagation of news that negatively impacts one’s portfolio, we developed our proprietary “Market Neutral – Absolute Returns” strategies. In 2016, we only had a conservative strategy, which performed very well. In 2017, we launched an aggressive strategy along with the conservative strategy. These strategies have performed extremely well in 2017.

Last week, we hit a major milestone – New all-time highs in the Conservative strategy, as sown below. If someone is interested in numbers, please contact us using the link below or e-mail at: subscription.ust@gmail.com
Disclaimer: Performance numbers do not include fees and past performance doesn't guarantee future results
Last time, this strategy had reached these level was back in Aug 2016. Last 12 months have taught us very important lessons that have helped us improve our performance parameters and discuss investment approach in a very holistic form with our clients, rather than providing pointed near-term solutions. 

Lessons Learned: 
  1. There are no guarantees but being persistent is the key to long-term success
  2. Understanding that a portfolio can and will decline
  3. Reduce exposure on sharp gains even if it means to leave a loved position
  4. Probability plays an active role in the markets
  5. Fundamental reasons typically come out after the price action has already taken place or started
  6. At times a trade might seem counter intuitive because of perception
  7. Keep Learning: Improvements & Realization

We will analyze all of these learning in greater detail in next few blog posts. If you have any questions, please feel free to contact us on Twitter (@Survive_Thrive) or via e-mail.

What are we doing?
We have incorporated all of the lessons learned into our strategy algorithms' business rules. We hope that the implementation of these business rules and algorithmic real-time allocation will significantly improve portfolio results over the long-term. 

We will be testing the results over the next few months and could result in a new strategy for clients. Existing customers will get access to new strategies at a discount.

Positioning
Markets are at a critical juncture. However, knowing this is one thing and acting on this information is totally different in our experience. So far in 2017, we have mentioned several big moves on this blog and on twitter, but doubt if effective trading was performed around this analysis.

At this critical time, we are using proprietary models to expose clients to positions that have the highest success probability.  Performance - H1 2017 

Contact
  • Any investment / trading questions: Twitter (@survive_thrive)
  • Free e-mail subscription: Click on the button below and select "Free E-mail"
  • Invest with us: Click on the button below and select the last Investment Option and a Registered Investment Advisor will reach out to you.

Friday, July 21, 2017

Gold Could Experience Significant Gains

Summary:
  • Gold market Overview at the top of the post
  • Positioning / Investment options at the bottom of the post
  • Analysis: Short, Medium and Long-term analysis with rationale in the middle

Introduction
On April 4, 2017 we mentioned that the Gold rally could pause over here. At that point Gold was at 1263 and today its at 1245. Following chart shows the ~4 month sideways consolidation in Gold:

What happened to Gold was that it succumbed to excessive optimism among market participants and as a result wasn't able to muster enough strength or the wall of worry wasn't strong enough to allow Gold to climb beyond immediate resistance levels.

At the same time, stock markets around the world did pretty well, which dampened Gold's demand. As a result, sentiment turned extremely sour towards precious metals. for example:
  • Daily sentiment Index reached: 10 out of 100
  • Long Positions of major hedge funds reached lows not seen since late 2015
  • Articles started coming out proclaiming much lower Gold prices and Bitcoin being the new Gold
Both of these development highlighted the fact that in July (after 3 months), wall of worry had again gotten stronger. And now we are at a different phase in Gold. We will evaluate Gold from near-term perspective to long-term to understand what is coming-up next.

Near -term:  Since July 11th  Gold has been stair-stepping higher without any major move, which is good because its moving under the radar. Secondly, it is tracing out a sequence of 1s and 2s, which can lead to a sharp move higher in wave 3 of 3. 

Medium Term: While Gold and Gold stocks prepare for acceleration on the short-term time frame, they are also positioned very well for a rally in medium term. Because at this time frame, Gold also completed a sequences of 1s and 2s. Even though following chart shows Gold stocks, bullish case for Gold is similar if not better.

Longer-term: Gold is tracing out an inverted Head and Shoulders pattern. This pattern, once broken can lead to 1400 price. Important thing to note is that this price target might will not be achieved in one day but will reach there over time.

Rationale: There are many reasons that can propel Gold to higher levels some of these include:

  1. Potential correction in Stocks and Gold acting as the safety trade
  2. Potential increase in geo-political tensions
  3. Continuous weakness in US Dollar Index, which was one of the big trades at the start of the year but we mentioned in February on twitter (@survive_thrive) that this US Dollar rally might be over, so one should look for alternatives. We will discuss US Dollar index in greater detail in another post. 


Positioning
Markets are at a critical juncture. However, knowing that is one thing and acting on this information is totally different in our experience. We mentioned following big moves on this blog/twitter in 2017 but doubt if effective trading was performed around this analysis:

  • March Top
  • April Top in Gold
  • April Bottom in Stocks
  • Emerging Market buy in February
  • Early July bottom in Nasdaq
  • ...

At this critical time, we are using proprietary models to expose clients to positions that have the highest success probability.  Our strategies have generated consistent returns, while taking advantage of new market opportunities and minimizing existing risk. We provide Absolute Return Hedge Fund like strategies through Managed Accounts. Performance - H1 2017 

Contact
  • Any investment / trading questions: Twitter (@survive_thrive)
  • Free e-mail subscription: Click on the button below and select "Free E-mail"
  • Invest with us: Click on the button below and select last Investment Option and a Registered Investment Advisor will get in touch with you.

Thursday, July 13, 2017

Stocks Approaching Dangerous Levels

Yesterday's rally in all of the major indices $DJIA, $SPX, $EEM, was very well received and triggered many tweets regarding Dow being at all time highs. Even President tweeted that stock markets are doing Great! I would recommend against such tweets because:
  1. What happens when the market goes down? If one owns a rising market, they would have to own the declining market as well, which could be much more negative.
  2. Market risks are increasing and we are close to a turn in the markets, which will correct post-election rally. Hence, a deeper correction can be expected. 
Following analysis supports the correction hypothesis (not a Bear market for now). Please note that below analysis is predictive and unlike mainstream finance, which is reactive, this analysis helps in understanding potential market move before time. This analysis also plays a pivotal role in our client portfolios (H1 2017 Performance has been shared). There are four key components:
  1. Structure
  2. Technical/Divergence
  3. Market Timing
  4. Sentiment
This correction could last for few weeks/months before resumption of the trend because we don't see a Bear market right away. But do you want to be part of a market when its going down and the headlines are negative? Some investment suggestions are included at the end.

Structure
Firstly, the Elliott Wave structure is nearing completion. Once this 5-wave rally completes, we will see a decline. Next decline could bring DJIA back to ~20,500. As for the upside, if current structure (As shown below) holds, Dow Jones Industrial Average cannot exceed 22,000, which is less than 500 points from yesterday's close.


One of the lesson that we have learned over past several years of market analysis is that one cannot and should not blindly believe on Elliott Wave structure without considering the market backdrop.

Divergences
Inter-market divergences highlight discrepancies between markets. These discrepancies typically take place in 5th wave where markets start diverging. We can currently seeing a divergence between SP500, DJIA and Nasdaq (shown below).


Please note that these divergences don't mean that long-term trend has reversed. On the contrary, there are no signals (structural or momentum) that this decline could lead to a new bear market.

Timing
Our proprietary market timing model has a key market turn date scheduled for July 14 (+/- 4 business days). Therefore, we can expect a top by next week.
This model has worked very well in the past and also serves as a key component of our proprietary strategies. We are working on developing a unique trading system around IPM, with potential go-live in 2018.

Sentiment
Following charts show that sentiment is very elevated. 

Long positions in DJIA are at all time highs, which does not bode well for a sustained rally.

Investor Intelligence survey respondents are mired in the bullish region for quite some time, and same is the case with Naaim survey results (charts courtesy of Babak).


Lastly, these two are very interesting.

TD Ameritrade users are very Bullish and are showing it with their trades. Since these are real retail investors, them being so bullish doesn't bode well for the markets.
More than half of E-trade users are also optimistic regarding the prospects of the market, which is another warning signal (Courtesy Noon Six Cap)

Positioning
Markets are at a critical juncture. Preparing for such a decline will depend on personal risk tolerance and tax considerations. Everyone should evaluate their investments through following key investing questions:
  1. Am I ready for a stock market trend change?  
  2. Will I have the mental strength to go against the herd?  
  3. Can I take advantage of new opportunities?
If you think you have too much exposure to stocks, you can reduce some exposure to be able to buy again. If your comfortable taking a hit to the portfolio knowing that you might not be able to enter back in time, it's better to ignore the news and remain invested. Worst thing a person can do is not reduce exposure at top and then get stressed with market/news, ad get out at the bottom, only to see a resumption of the rally.

Alternative Solution: We are helping clients answer above questions every day. And have developed our proprietary strategies to generate consistent returns, while taking advantage of new market opportunities and minimizing existing risk. We aim to provide Absolute Return Hedge Fund like strategies for individual investors through Managed Account model.

Feel free to contact us with any investment questions or if you would like to invest with us (Performance - H1 2017):

  • Twitter: @survive_thrive
  • E-mail: subscription.ust@gmail.com 
  • Comment below
  • You can also sign-up for free email updates below: 

Thursday, July 6, 2017

H1' 2017 Market & Strategy Performance Review

First half of 2017 was very eventful where SP500 continued to rally in face of many uncertainties. Hence, it was a difficult period of investors as they had to absorb a lot of headline risk and be brave in their investments. Both of our proprietary strategies have beaten SP500 in 2017 with good margins and with uncorrelated returns. Therefore, not being influenced by news headlines.

Let's first review the markets in H1'2017 to gain a perspective for circumstances in which market beating uncorrelated performance was given. 

Market Recap
First half of 2017 was very eventful. It started with an overbought market, which continued to gyrate with new president coming into the office. However, earnings propelled the market to new highs in February. Market topped on March 1 (within IPM turn window) for 1.5 month decline. 

At the time, many reasons were given for this decline including overbought market, high valuations, sentiment, potential for unfulfilled presidential promises and geo-political turmoil. However, market resumed its rally with Q2 earnings in April (again within IPM turn window). But in the process, many investors had to exit the market due to confusion regarding future direction. This is why investing is a difficult task.

Market rally continued in May through early June. as market was approaching a key IPM turn window on June 8th (posted on twitter), we saw excessive optimism from famous investors calling tech stocks extremely cheap. While on one hand this proclamation was very dangerous because tech stocks had already rallied substantially and they were rallying without any real profits, these headlines make investing very difficult for long-term investors because of emotional attachment. 

Fast forward 1 month from June 8 and Nasdaq is down ~5% from the top. And many of the reasons for market correction that were being discussed in March are still here but are not being discussed because markets are near the highs. And lastly, stocks have rallied for consecutive ~8 months. Everyone should ask themselves if their portfolio is positioned to absorb increased volatility because it will come, and to potentially take advantage of rotation.

In order to properly and profitably navigate through markets where extreme gyrations and news driven moves are the norm, one needs to maintain their composure. Hence, we created strategies that don't depend on market news, rather take into account underlying market tones to make investment decisions. This reduces transaction cost, dampens volatility, moves taxes to long-term bucket and generate consistent results.

Portfolio Strategies
Two strategies are currently live. Goal for both is to generate absolute, uncorrelated returns for long-term growth:
  • Conservative: Suitable for retirement accounts and risk-averse investors
  • Aggressive: Suitable for risk taking investors, with longer-term invest goals

Note: Following strategy performance numbers exclude fees.

Conservative Strategy: 9.59% vs 9.34% for SP500 (w/ dividends)

In 2017, Conservative strategy has beaten SP500. Keep in mind that SP500 has had a very good start of the year since 1950. 
H1 2017 Performance 


Aggressive Strategy: 23.75% vs 9.34% for SP500 (with dividends)

Aggressive strategy has performed very well in 2017. 

H1 2017 Performance 


Although past performance doesn't guarantee future results, H1'2017 performance was very good for both strategies. June was the first negative month after 6 positive months, providing a much needed correction to avoid over-heating!

Conclusion
The best aspect of these strategies is that they enables the investor to concentrate on the work that is more important in life than losing sleep over investments through daily news because we do the research and invest using proprietary algorithms and valuation models.

These strategies are open for investment. Please feel free to contact via subscription.ust@gmail.com for details. These strategies are being implemented via managed account setup through a Registered Investment Adviser. As a result, you keep control over your assets. 

Please contact us for details. You can also sign-up for free email updates below: 

Monday, June 26, 2017

Market Update - June 26, 2017

Markets have been gyrating sideways with an upward-tilt over the past few weeks. Since the start of January, we have seen a rotation from Tech stocks to Industrials and as a result DJIA has reached all-time highs, while NASDAQ remains below its May highs. 

Stock Market Turn
We have discussed the possibility of a July top in the equity markets on multiple occasions on Twitter: @survive_thrive, and the July turn window being in close proximity to Q2 earnings season, supports that observation.


However, we don’t think that it will be the start of a major new down trend. Rather market could go sideways to down for few months, but will likely see a resurgence towards the end of the year because of following two reasons:
  1. Bond Yield Dynamics
  2. US Dollar Dynamics
Yield Curve:
So far we have not seen an inverted yield curve i.e. near-term rates being higher than the longer-term rates. In a normal world, longer-term rates are higher because long-term (30 years) lenders expect more interest than short-term (2 year) lenders, as they take more risk.


However, when yield curve flips it suggests that there is something fundamentally different in the overall interest rate structure. And when this happens, we typically see a recession. In fact, all of the recessions since 1950s have been accompanied by the inverted yield curve phenomenon. Therefore, we should keep an eye out for it.

At this point, the yield curve is flattening but is not inverted. Following two charts show this change. 

Yield curve in April 2013 was very steep (above), while now its getting flat (bottom).


It might take another 2-3 Federal Reserves’ rate hikes to trigger the flip. This goes along nicely with the concept of continuation of stock market rally for the time being.

US Dollar
There are interesting developments happening in the US Dollar index and commodities markets especially Gold. Although Gold prices have been in a holding pattern for last 2 years, China and Russia have started dealing in Gold-Yuan for oil trade, rather than US Dollars. At the same time, cryptocurrencies like Bitcoin and Ethereum are becoming popular. All of these developments suggest that US Dollar has some really strong head winds.

When you combine this with US Dollar's price structure, we see that Dollar will be under significant pressure over next several years. We will discuss the US Dollar's price structure in another post. 

Most recent rally in US Dollar lasted for ~10 years (since 2007), and could lead to significant devaluation. If the US Dollar declines due to underlying changes in global economic structure, it would send Gold significantly higher. And many other opportunities will arise due to this development

Investment Decision
These two are big themes that we see in today’s market. While we are currently positioned to take advantage of these big moves, we will keep an eye out for any emerging opportunities. 

Everyone should evaluate their investment process on two fundamental investing questions:
  1. Will they be ready when the current trend changes in the stock market? 
  2. If yes, will they have the mental stamina to go against the herd and make a buy/sell decision before it's too late? 
  3. Am I positioned to take advantage of what market is offering today and could offer in the near future?

We can help you answer above questions and recommend a strategy that can work over time and in different markets. Feel free to contact us with any investment questions on twitter or via e-mail.

Our proprietary strategies are based around above two fundamental questions with the goal of providing absolute returns in any market condition. As a result, we are positioned to take advantage of big market themes while managing risk to limit potential losses. These strategies are open for investment. Please feel free to contact via 

You can also sign-up for free email updates below: 

Wednesday, April 26, 2017

Q1 2017 Performance Review

Recap
First Quarter of 2017 was very eventful. It started with an overbought market, which continued to gyrate with new president coming into the office and confusing Executive Orders. While all of this happened in January, earnings started coming in better than expected and propelled the market to new highs in February.


After topping on March 1, within IPM turn window, market declined for rest of March. Many reasons were given for this decline including overbought market, high valuations, sentiment, potential for unfulfilled presidential promises and geo-political turmoil. Sadly, this wasn't something new. These kind of events happen all the time, making investing an arduous task.


Now the question is how can someone properly and profitably navigate through such tumultuous markets, while maintaining one's composure. That's why we created strategies that don't depend on market news, rather take into account underlying market currents to make investment decisions. This reduces transaction cost, dampens volatility and increases consistent results.


We are currently running two strategies. Goal of both portfolio is to generate absolute, uncorrelated returns for long-term growth. These are:
  • Conservative: Suitable for retirement accounts and risk-averse investors
  • Aggressive: Suitable for risk taking investors, with longer-term invest goals
Although both strategies performed amazingly well in Q1'2017, we will review their performance individually.


Conservative - Enhanced PSB (Green )
Conservative strategy went live in 2016. It returned 6.8% (excluding fees) against 6.1% return of SP500 total returns including dividends.

Following chart shows the cumulative performance of Conservative portfolio since inception. Strategy returned 19.8% (excluding fees) vs SP500 total return of 19.8%. In 2016, conservative strategy outperformed SP500 12.2% vs 12%.


Aggressive Strategy - Aggressive Enhanced PSB (Orange)
Aggressive strategy went live in 2017. It returned 15.6% (excluding fees)  against 6.1% return of SP500 total returns including dividends.

Since this strategy went live in 2017, Q1'2017 performance of 15.6% also shows the since inception performance of the Aggressive Strategy.


Although past performance doesn't guarantee future results, Q2'2017 performance remains very robust for both strategies.


The best aspect of these strategies is that they enables the investor to concentrate on the work that is more important in life than losing sleep on investments while looking at news all the day because we do the research and invest using proprietary algorithms and valuation models.


These strategies are open for investment. Please feel free to contact via subscription.ust@gmail.com for details. These strategies can be implemented via managed account setup through a Registered Investment Advisor. Please contact us for details. You can also sign-up for free email updates below: