Twitter

Monday, December 21, 2015

Bonds Rally Analysis and Stocks

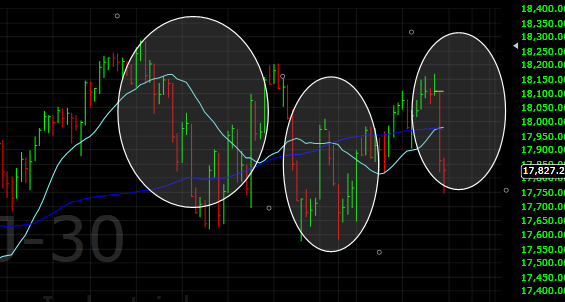
Market's decline on Friday was very sharp and was on top of Thursday 250+ point decline in $DJIA. This decline has brought the market to a critical support level in Nasdaq and $DJIA, while in other indices like Russell 2000 and $SPY this critical level has already been broken to the downside.

Downside break means that the near term trend has turned down. Although some technical analysts might take this decline as a trend change signal, at UST we have been suggesting that a sea change has already taken place in the stock markets in August.

Unfortunately, many market participants are still not seeing the bigger picture because they don't follow objective trend analysis. Instead, they follow the market events and try to gauge the markets response to these events. At Understand, Survive and Thrive, we have always used objective market analysis and statistical models to identify market trends and turn points.

In the last post (link), we analyze the significance of recent Federal Reserves action and suggested that although the Federal Reserves thinks that the economy is strong and they can raise rates, this rate increase could not only have negative consequences on the market but also could result in lower rates. Longer term rates are governed by the perception of the economy of market participants and if investors don't believe in the same story of strong fundamentals, they might keep on buying the bonds, resulting in lower bond yields and higher prices.

Although this concept does not make intuitive sense, it was evident in the last few days where the market went down and interest rates also went down even after Fed's rate hike.

We have already discussed the potential fundamental issues with the economy and how its depends on the perception. There are also several technical reasons behind rally in bond prices:
  1. Inverted Head and Shoulders Pattern
  2. Capital outflow from bond funds
  3. Proprietary trend indicator
Current pattern in the bonds suggests that the longer term bonds, as depicted by $TLT below, are carving out an inverted head and shoulders pattern. As you know, inverted head and shoulders pattern is a bullish pattern and shows trend reversal from lower to higher. So it will be interesting to see how the market reacts over the next few weeks when this pattern matures and is about to break-out.


From socio-economic and sentiment perspectives, in anticipation of Fed's announcement many people jumped ship from the bonds and exited in great numbers. This could be interpreted as a potential contrarian buy signal for longer-term bonds.

Finally, as we have been saying for quite some time, bonds are in bull market for some time and will remain till model says otherwise. Therefore, we will find reasons for the bull market to continue which can be either due to economic weakness, technical rally or delay from Fed in raising rates further.

Please note that this analysis is only pertaining to high quality long-term bonds and not related to Junk bonds, which are linked to the economic activity. Weakness in economy would result in a decline in Junk bonds, as we have been witnessing over the past few months.

Friday, December 18, 2015

Fed Decision and its Impacts

After 6 years, Federal Reserves raised the Fed benchmark rate. While on one hand it signifies the fact that the underlying economy is doing well because of which Fed increased the rates, it also suggests that the market should embrace the new normal i.e. upcoming higher interest rates. Higher rates can impact many different walks of life ranging from savers to home owners.

Higher rates mean lower bond prices and could impact:
  1. Home buyers
  2. Credit Borrowers
  3. Real estate investors
  4. Savers
  5. Equity investors
  6. Bond investors
Although one can write separate blog posts for every individual class, the major theme will revolve around increased cost of credit. With increased borrowing cost, it will get difficult to buy homes, borrow for credit card purchases, borrow for investments in real estate or other venture, thus reducing the flow of money in the economy.

It will also encourage corporations and individuals to save and at some point make equities less appealing, as they will be able to get higher rates without added risk. Please don't get me wrong - savings are the engine of long-term economic development, while spending helps in the short-term.

Since the rates and prices move in opposite direction, rate increase by Feds means that bond prices will decline. However, contrary to this simplistic idea, UST's proprietary bond market analysis suggests that longer term bonds are still in a bull market. It is one of the 3 primary asset classes that is in a bull market.

Therefore, bond investors should not be scared by this Fed hike. Bonds will continue to do better for some time. This also flows well with our discussion on objective trend following, in the last blog post. Objective investing requires one to analyze asset classes holistically rather than event based analysis. And at this point, holistic picture based on proprietary indicators is suggesting that the bond market will do better. This could mean:
  1. Stocks are going to perform poorly to push interest rates down even with fed hikes
  2. Fed fund rate hikes will be in contrast to economic reality, and could result in yield curve inversion
Both of the above scenarios are bad for economy and investors. In the next few posts, we will discuss:

  • Detailed discussion on potential causes of bond yield decline even with Fed's increased rates
  • Alternative investments, according to their state - Part 2
  • Elliott Wave analysis of current stock market
  • Asset allocation options
  • Tax implications 
  • Revisiting Objectivity and market trend

  • Let me know if you think the best time to buy homes is about to come or has already passed?


    Monday, December 14, 2015

    Importance of objectivity in trend following

    Market managed to put in a nice turn-around and must have made many market commentators happy. However, the market remains in a downtrend and in a bear market, according to our proprietary models. In a bear market, we expect to see nice rallies - rallies that can shake the shorts and lure in more longs.

    Although we are still near the highs, as measured by $DJIA and $SPY, small caps, junk bonds and Global Dow are significantly lower. In facts, some of the major indices are completing Head and Shoulders patterns, shared in the last post.


    From a socio-economic perspective, euphoria is the primary driver near the top. And last week's milestone climate agreement is a sign of remnants of euphoria of the bull market. We have talked about market psychology is greater detail in prior posts on the blog, so we won't get into that discussion over here. But we need to make sure that all the market analysis tools are good, but one can only make money in the market by being aligned with the broader trend.

    No matter whether its a Bull Market or  a Bear Market, trend is your friend. I have seen people getting wiped out in both Bull and Bear markets because they fought the trend. Therefore, if the current market is trending down or we are in a bear market, one should not get excited about the rallies. In fact, in bear markets following are the keys actions an investors should take, depending on his/her risk profile and personal situations:

    1. Exit longs except for very solid dividend paying stocks (if cannot exit longs due to tax reasons)
    2. Enter positions in asset classes already in bull markets
    3. Short with a fraction of portfolio because shorting is very dangerous and is for professionals (link to sad story)
    If someone wants to short, shorting an ETF is much safer than shorting an individual stock because of diversification. After all, risk management should be the top priority of every investor. Never the less, the most important part of any trade is to consistently be on the right side of the trade and hold on to positions for the longer-term to avoid short-term capital gains rates, which can sting at the end of the year, especially if your in the top 39% tax bracket.

    Now the key to being on the right side is being OBJECTIVE in your assessment of the market.

    Image result for objectivity
    Although there are many ways by which one can bring objectivity into investments, UST team has done significant analysis on identifying Bull/Bear markets using objective statistical analysis techniques. At some point we will go into the details, but right now these models are saying that:
    • Stocks - Bear
    • Bonds - Bull
    • Bit Coins - Bull
    • Gold - Bear
    In the next few posts we will discuss:
    • Elliott Wave analysis of current market
    • Alternative investments, according to their state
    • Asset allocation options
    • Tax implications 
    • Revisiting Objectivity and market trend
     

    Friday, December 11, 2015

    Technical Overview of the Market

    Market is in sideways range and in doing so it has traced out a triangle pattern. Pure technical analysis says that longer term triangle patterns suggest that a trend reversal is approaching. Triangle pattern in DJIA is shown below:


    While triangle pattern is almost complete, one could also construe market's current pattern as a head and shoulders pattern. However, the problem with this assumption is that the current pattern can be regarded as a either a upright Head and Shoulders or inverted Head and Shoulders.

    Upright head and shoulders pattern suggest a market topping pattern. If market is playing out this pattern, we are in the right shoulder. In order to complete the right shoulder, market should decline from current level to the neck line. This potential pattern is shown below:


    On the other hand, if we consider that currently market is undergoing consolidation and will soon breakout, an inverted head and shoulders pattern will support that call. In fact, current market structure also supports a potential inverted head and shoulders pattern, as shown below:


    However, the fundamental flaw with this pattern is that its target, if pattern is completed, would mean that SP500 would rally to 2350. This means that economy has to do very well and easy monetary policy should continue. However, both of these are unlikely scenarios because after ~6 years of economic expansion, we are due for a recession.

    Furthermore, proprietary indicators suggest that the stocks have entered a bear market in August and internals have continued to deteriorate since then, even with the sharp rally that we have seen over the past month or so. Therefore, one should be weary of the market and its prospects. Market should now prove itself before one can fully commit to the long side.

    On the other hand, there are other investment vehicles like BitCoin, which has just entered a new bull market according to proprietary Bull/Bear model and could yield substantial gains for investors. But please keep in mind that BitCoins are very volatile and portfolio size should be adjusted accordingly.

    In the upcoming blogs we will talk about:

  • Importance of objectivity and trend following
  • Elliott Wave analysis of current market
  • Alternative investments
  • Asset allocation
  • Tax implications
  •  

    Wednesday, December 9, 2015

    Current Market - Bear Case Evaluation

    Over the past few weeks we have seen a stagnant market. In fact, entire 2015 was a sideways market with SP500 starting the year around 2080 and is now at 2060. Although sideways action is good to digest gains, this kind of action can also be attributed to distribution. Distribution means shares are being sold by strong hands to weak hands. Distribution typically takes place near the top and results in market declines.

    From a psychological perspective it makes sense because when the people how bought at lower levels sell and people who buy at higher levels are left in the market it has two consequences:
    1. Weaker buyers are the first to sell, which exaggerates selling
    2. When all the buyers have bought, sellers are left in the market. Since weak hands join the rally towards the end, the concentration of sellers is very high near the top
    At the same time, the weaker buying hands are being sold-to by strong shorts. That's why this process is known as distribution. Now there can be this argument, as stated above, that we are tracing out a longer-term consolidation pattern before a very nice rally. Although this is possible, it is unlikely due to the following facts:
    1. Average gap between recessions in the US, over the past century, is ~5 years. Since last recession ended 6 years ago, we are due for another recession
    2. Markets rally in easy monetary policy environment. Under current circumstances, Federal Reserves is planning to raise the interest rates, which will reduce the monetary supply that fuels bull markets
    3. Stocks PE valuation is also at a very high level, which is another reason not to be very aggressive with the stocks
    Above reasons suggest that from a fundamental perspective stocks are not the most attractive investment opportunity at this time.

    Our proprietary model suggests that the stocks entered a bear market in August and recent rally hasn't been able to change that status. Market will remain in the bear market mode till we see a broader rally. However, so far we haven't seen the kind of broader rally that is a hall-mark of a new bull phase.

    Therefore, we will continue to evaluate the market conditions and also review other alternative investments at a time when the stocks don't seem to be the best option. In the next few posts we will  cover:
    • Technical overview of the stock market
    • Importance of objectivity and trend following
    • Alternative investments
    • Asset allocation
    • Tax implications


    Thursday, October 15, 2015

    Investment Optimization Model (IOM) Performance - September 15

    September saw extreme volatility. Model went all cash on September 1st and stayed away from the volatility. However, September 1st saw a sharp negative open in the market. It was the same day when the market went to cash at the open. As a result, model was hit from a returns perspective.

    However, from peace of mind and Sharpe Ratio perspective, it did very well. 

    Model remained on the sidelines through out the month of September to evaluate the market and decide its next steps.


    Wednesday, September 9, 2015

    Investment Optimization Model (IOM) Performance - August 2015

    August turned out to be a very interesting month. It all started with market's internals deteriorating towards the end of July, which created a scenario where either market would have set-up a break-out or could start a sharp decline. In this situation, China came out with a plan to de-value their currency to prop-up their economy. However, this plan un-nerved the global markets.

    This nervousness led to a global market sell-off in mid-August. Although the market managed to put-on a very sharp and impressive 1000+ point rally, it was not sufficient to keep it into the Bull territory. As a result of this decline, markets have now entered Bear market territory based on our proprietary Bull-Bear model. This model last signaled a top in Feb 2008 and prior to that in March 2000. Therefore, we can expect some serious decline ahead.

    However, before the start of the decline, we might see a sharp rally for a couple of monthly to test certain key levels and suck back investors into the market, how people were sucked in in March/April 2008 and late 2000, before the sharp decline.

    In such dangerous market environment, Investment Optimization Model portfolio once again outperformed the market. Since March 2015, IOM has beaten DJIA (w/ dividends) by 4% (model is down 3.7%, while total return DJIA is down 7.7%). Furthermore, now that the market is in a bear market, the model has gone 100% cash and is looking towards shorting model (currently under development).


    In other words, model has generated Alpha without taking on extra risk and is now in a position to not only avoid bear market losses and beat the market, but also to take advantage of the decline. Model's in built, risk management mechanisms ensured removal of underperforming stocks and heavier allocation to stocks with better fundamental and technical pictures. 

    The Investment Optimization Model (IOM) has been developed to manage risk and amplify gains. In order to do so, the model is deigned to out-perform its benchmark in following three distinct environments: :

    1- A market which is trending up
    2- A market which goes sideways and down
    3- A Bear market

    In an up-trending market, the model's components will outperform its benchmark because the stock selection is based on a systematic method of identifying stocks exhibiting certain features and higher gain potential.

    At the same time, strict risk management process ensures that if a single entity is doing bad, asset allocation is reduced. In a sideways market, the model is designed to outperform and preserve capital.

    Finally, in a bear market, model will not only preserve capital using proprietary risk-management strategies, it will also short the market and diversify in other asset classes.

    Therefore, the model is very holistic and so far in 2015, it has proved to be very valuable. Moving forward, we are working on enhancing the model with additional business rules to not only amplify portfolio's return potential by combining it with the proprietary Inflection Point Model. We will keep the blog updated with latest performance and enhancements.

    Monday, August 24, 2015

    Stock Market - Black Monday (Aug 21, 2015)

    Today's market action was very scary. Since last week to today's lows, markets decline over 10%. This decline wiped out more than ~$1.5 Trillion in wealth from the stock market.

    If you had looked at the news today, it was horrific. There was live coverage on the decline even on channels like CNN. I have received several calls from investors trying to figure out if they should enter the market or not. And how are the proprietary models of Understand, Survive and Thrive, reading into this market.

    I would like to start by saying that panicking will not help!!!

    DJIA completed a head and shoulders pattern at the top, which was not noted in the financial media. This kind of development suggested that we should expect this head and shoulders pattern to play out. However, I did not expect a crash like scenario.

    Now that we have seen the flash crash type of event, the big question is how should one proceed. Should we buy the dip or use the rally to sell-out of equities. In order to objectively analyze these two options, lets look at three Bull/Bear market indicators that we have used to great success.

    1. Yield curve inversion: Historically, over the last 50 years no bear market has ensued without yield curve inversion (link). If that is the case, yield curve is not inverted yet and therefore, we should give benefit of doubt to the market
    2. Proprietary Bull/Bear indicator, using optimum Bull/Bear criteria, is calculated on a monthly basis. As of last calculation at the end of July, it was registering 70%, which is above the threshold of 65%. Although the indicator will be recalculated on Aug 31, persistent market decline can result in us entering a bear market. This would mean that we have several months of lower prices ahead. The true result will come out on September 1st and therefore, no decision of exiting longs will be made till that time
    3.  Another very important Bull market indicator is still bullish which uses Global Dow as the proxy of global stock markets. It would need September data to declare whether we have entered a bear market or not.
    Therefore, next few days will be very crucial for the market. Since the yield curve has not inverted yet, the chances of entering a prolonged bear market are very slim. As a result, this should be a buying opportunity. If the market is to avoid entering a bear market based on proprietary indicators, it should rally hard over the next few days. From a geo-political standpoint, it would make sense for the market to stay up for till next year's election because there is no change in policy and Congress gridlock continues.

    In conclusion, we should expect a sharp rally over the next few days. Otherwise, markets will enter a prolonged bear market, which yield curves inverting over the next few months.


    Monday, August 3, 2015

    IOM Performance Evaluation - July 2015

    In an environment when Greek deal was so uncertain that Greek was almost booted out of the European Union, at a time when corporate earnings had started to disappoint and in face of Federal Reserve's anxiety around interest rate hike, IOM portfolio once again outperformed the market. Since March 2015, IOM has lead the market by 5.7% (model is up 3.7%, while total return DJIA is down 1.7%).

    In other words, model has generated Alpha without taking on very much risk. In built, risk management mechanisms have ensure removal of underperforming stocks and heavier allocation to stocks with great fundamental and technical pictures.  

    This outperformance is especially significant because it came at a time when the global markets were very uncertain. Following chart shows the market performance since March 2015.

    The investment optimization model (IOM) has been developed to manage risk and amplify gains. In order to do so, the model is deigned to out-perform its benchmark in following three distinct environments: :

    1- A market which is trending up
    2- A market which goes sideways and down
    3- A Bear market

    In an up-trending market, the model's components will outperform its benchmark because the stock selection is based on a systematic method of identifying stocks exhibiting certain features and higher gain potential.

    At the same time, strict risk management process ensures that if a single entity is doing bad, asset allocation is reduced. For example, last month LinkedIn was removed and this month Chipotle has been added back into the portfolio.

     In a sideways market, like right now, the model is designed to outperform and preserve capital.

    Finally, in a bear market, model will not only preserve capital using proprietary risk-management strategies, it will also short the market and diversify in other asset classes.

    Therefore, the model is very holistic and so far in 2015, it has proved to be very valuable. Moving forward, we are working on enhancing the model with additional business rules to not only amplify portfolio's return potential but also to forewarn about an impending bear market. We will keep the blog updated with latest performance and enhancements.

    Thursday, July 2, 2015

    IOM Performance Evaluation - June 2015

    In an environment when Greek is teetering on the brink of bankruptcy and economic uncertainty is roiling the market, IOM portfolio has outperformed the market with over two percent in merely 4 months (since March 2015).

    This outperformance is especially significant because it came at a time when the global markets were very uncertain. Following chart shows the market performance since March 2015.


    The investment optimization model (IOM) has been developed to manage risk and amplify gains. In order to do so, the model needs to out-perform its benchmark in following three distinct environments: :

    1- A market which is trending up
    2- A market which goes sideways and down
    3- A Bear market

    In an up-trending market, the model's components will outperform its benchmark along with strict risk management process to ensure that if a single entity is doing bad, it is replaced. For example, last month Chipotle was removed and this month LinkedIn was removed from the portfolio.

    Secondly, in a sideways market, like right now, the model is designed to outperform and preserve capital.

    Finally, in a bear market, model will not only preserve capital using proprietary risk-management strategies, it will also short the market and diversify in other asset classes.

    Therefore, the model is very holistic and so far in 2015, it has proved to be very valuable. Moving forward, we are working on enhancing the model with additional business rules to not only amplify portfolio's return potential but also to forewarn about an impending bear market. We will keep the blog updated with latest performance and enhancements.


    Thursday, June 18, 2015

    Model Performance Review

    Performance Review

    DJIA (since March 1, 2015) = -1.06%
    SP500 - Total Return (since March 1, 2015) = +0.46%
    Model (since March 1, 2015) = +1.97%
    With model outperforming the market handsomely over the last 3.5 months and in a directionless market, it seems like it has added significant value. The best part is that the model has inbuilt risk-mitigation mechanisms, which ensure that no single stock gets extra weightage and any stock which enters its respective bear market territory, is removed from portfolio.

    The best example in this regard is the removal of Chipotle from the portfolio and addition of Krispy Kreme, which rallies sharply.

    In the mean time, UST team has been analyzing the model using strict stress testing mechanisms and we will share our findings on the blog.
     

    Friday, June 12, 2015

    Removing $CMG & Adding $KKD

    Markets have rallied, as anticipated. Sideways action since the start of this year has laid the foundation for strong move. Once the market moves out of current range, we can experience acceleration to the upside. However, the extent and longevity of acceleration is anyone's guess. That is exactly why, one needs to follow a system for investing and trading.

    Investors with a unique, easy to follow but comprehensive strategy can make constant income in the stock market without taking huge risks. However, the more one risks, the more are the potential gains. Therefore, it again depends on one's risk appetite. At Understand Survive and Thrive, we have developed a short-term and a long-term trading/investing model.

    Short-term model involved a lot of volatility with strict risk management. Whereas, long-term model, manages risk effectively and also generates excellent without continuous stock market monitoring. This model generated a sell signal on Chipotle at the beginning of June and generated a buy signal for Krispy Kreme at the same time.

    As with any algorithmic system, trade has to be taken when it is generated without any question. As a result, Chipotle stock was sold and the position was closed in the portfolio. At the same time, Krispy Kreme shares were added to the portfolio.

    As of today, $CMG has gone further down (shown below).


    Whereas, $KKD has rallied sharply on an upbeat earnings report.


    Similar situation happened with Amazon in January and other stocks over the past few months. So far, model portfolio has outperformed a sideways to down market since March 2015, with a very impressive margin (by the grace of God):

    DJIA (since March 1, 2015) = -0.73%
    Model (since March 1, 2015) = +1.88%

    The best part is that the portfolio analysis and trading times are minimal. Consequently, minimal stress with impressive risk-management.

    In the next post, we will talk about how do fundamentals stack up for Chipotle and why has it gone down.

    Sunday, June 7, 2015

    May Market Review and Model's Performance

    May was a rough and volatile month for the markets. It was marked by uncertainty and a volatile bond market. Investors were freaked-out by the poor economic numbers of the first quarter, along with poor indicators like housing starts etc. At the same time, the bond market was undergoing very sharp swings, highlighting the angst bond investors were experiencing in the face of upcoming rate hike by the Federal Reserves.

    Rate increase by the FED will cause the rates to increase across the entire spectrum. As we know, rate increase results in a decrease in value, which would result in huge market losses for bond investors. In order to avoid such losses, many investors were rushing to the exit.

    May's choppy market action is showcased by the following chart, which shows DJIA over the month of May. As you can see the market saw wild swings but overall rise was minimal.


    At the end of the month, DJIA managed to gain slightly more than 1%. However, the model portfolio lost 0.4%. Since the model's goal is to generate results in any market, May's under performance was an anomaly. So far the model portfolio has beaten the market since November 2014.

    Following chart shows model's performance since March 1, 2015. We have selected March 1st because at the start of March, full account was invested per the algorithm .Therefore, this will give us the best understanding of the performance.


    As mentioned before we will keep tracking the model on a monthly basis to highlight its value. Please note that the goal of the model is to beat the market by managing risk, following trend and balancing portfolio using proprietary algorithm. The model undergoes trades once a month and rest of the month there is no change to the holdings.

    One of the holdings that was removed form the portfolio this month was Chipotle ($CMG). We will discuss Chipotle in greater detail in the next post.

    Thursday, May 14, 2015

    Market and Economy: How Model Helpds

    Market performance has remained lackluster to say the least. Economic data, specially spending report, came in very weak. This was even more troublesome with lower gasoline prices and lower unemployment rate. Lower gas prices and lower unemployment rate have given extra cash to the consumers. However, consumers are holding on to that cash and are not spending it. This either means that they are not confident of the economy or there is something else going on in the economy.

     As a result of these economic cross currents, market keeps on going sideways, unable to decide its direction. One barometer that has been used by market participants in the past few weeks is the yield on long-term treasuries. Yield has been increasing very sharply. This means that the expectation of inflation is going up. If the inflation expectation goes up, precious metals will start performing well.

    So far, this sideways action has not impacted the model portfolio. Stocks have been doing well. The best part is that the stocks that aren't doing as well, like the market, are the one whose exposure was reduced. And the stocks that are doing well are those whose exposure was increased as per the model.

    Therefore, unlike a typical portfolio which rises and falls in tandem with the market, the smart algorithm based portfolio builds on the bull-market characteristics and properly allocates the funds to amplify the gains. As a result, one will not feel lost about why are they wasting time by keeping their allocation and not seeing any changes in their portfolio and not being able to beat the market.

    Another interesting stock included in the model portfolio is Chipotle. Although Chipotle hasn't done well in the last 2 months, its still in a bull market. If it closes below 630 at the close of May, it will be a sell signal. However, prior record suggests that the stock should rebound. Therefore, its a good buying opportunity. If it closes below 630, stock will enter a bear market of its own and all the shares will be sold. Proceeds from this sale will be re-allocated by the model.

    We will keep evaluating the portfolio strategy and understand different ways of implementing these across different style of portfolios. 

    Sunday, May 10, 2015

    Protfolio Performance & Stock Market

    Market responded very nicely to the employment report. With a strong employment report, it seems like the economy is back on track to put in a strong performance in the second quarter. Next couple of weeks will bring more economic data to confirm this observation.
     
    As we have been talking over the past few weeks, market is still in a bull market. It has completed a sideways correction, which has lasted over several months. We have gathered enough fuel to break out of this range and embark on the next journey to new levels.
     
    Dollar tree has performed pretty well over the last week. Next stock that we will be looking at in Chipotle. Chipotle has to perform well in this month. Otherwise, it will be removed from the portfolio. :Lets see how it performs over the next few weeks.


    Friday, May 8, 2015

    Portfolio Positions - Dollar Tree

    Sideways action continued this week also. This sideways action can be very demoralizing for regular market watchers, as no one really knows what will happen next. But there is a famous phrase on the street, which says that "one should not short a dull market." Although this market is not dull on a day-to-day basis, it has been pretty dull over the last few months.

    Good investors make money in these type of markets by selling stocks that have already rallied during this phase and re-distributing proceeds into positions which have not performed so well. In this way, they are better positioned to take advantage of potential rally.

    A very good example in this regard is Amazon. Amazon declined throughout 2014 after topping around 400 in late 2013. While Amazon was declining, it was a good opportunity to accumulate. Since Amazon was in a bull market based on proprietary model, adding to long positions paid off big time in 2015 with Amazon rallying from 300 to 430 in just 4 months. Therefore, the gains would have been amplified, as one would have bought multiple shares at lower price.

    The goal of the new model is to buy good businesses that actually sell tangible products or services. This would mean that investors are actually investing in good companies.

    The most recent example in model portfolio is Dollar Tree stock. Dollar Tree rallied in the first two months of this year, but since then it has been declining. As a result, proprietary allocation model increased the exposure in Dollar Tree in May because it is in a bull market. Model will keep on changing the ratio based on analytic modeling, as long as the stock remains in a bull market.


    If the stock is truly in a Bull market, it will rally sooner or later and thus, gains will be amplified. If not in bull market, portfolio will exit the stock position on proprietary triggers. We will see...


    Sunday, May 3, 2015

    Market Review - May 3, 2015

    After declining sharply on Wednesday, post GDP data and Fed announcement, market bounced back sharply on Friday. Overall, sideways market action continues. Soon the market will leave its current range.

    Although the break from this range can be in either direction, chances are increasing for an upside rally. Some of the reasons behind this observation are:
    1. Market has absorbed not-so-good earnings and a much weaker GDP data, without a sharp decline
    2. Market has already taken into account an interest rate hike 
    3. Market has held together over the past few months without significant Fed induced liquidity
    4. Market has gone sideways for the past 5 months. This sideways action can be treated as a triangle formation before the next rally
    However, one should keep in mind that we are now entering a traditionally weaker period for stocks and Nasdaq is approaching its all time highs. Since summer months don't yield good market returns and we can experience a sell-off due to double top formation in Nasdaq, things can get a little bumpy in the near term. This is the very reason, why one should trade with a system and not based on their opinion.

    In order to take out the opinions, UST has developed a new long term investing model with the goal of optimizing portfolio allocation by combining it technical analysis and capital growth theories.

    In comparison to short-term traders, investors with a long-term horizon, lesser time for market analysis and keen financial understanding, have a desire to accumulate wealth over time. In contrast, accurate short-term trading can yield more profits. Therefore, if one can combine short-term trading attributes with long-term approach, one can amplify the gains.

    UST team has utilized our expertise in algorithm based analysis and trading to develop a longer term investing. This model has been in test mode since November 2014 and has performed exceptionally well in out-performing the market.

    Although model's performance is being discussed on the blog for the past couple of weeks, following is a snap shot of actual market performance of the brokerage account where this model is being implemented in real-time.


    Please note that the snap shots start from March because the pull portfolio was moved to the model based investment on March 1, 2015. We will continue to evaluate the model, its performance, holdings and other aspects on the blog.

    Note: Overall market remains in a bull.
     

    Tuesday, April 28, 2015

    Fed and GDP report coming up

    Market declined in the morning on a news that geo-political event has occurred in the middle east. However, as the news came out that the event wasn't significant, markets rallied. At the same time, the turmoil in Baltimore kept traders on the edge.

    Although today's rally wasn't broad based, it showed that the broad gains that some stocks saw few days ago were being digested by sideways action.

    Tomorrow we have a lot of news coming. 1st Quarter GDP's initial numbers will be released tomorrow morning, followed by Fed FOMC meeting minutes. Therefore, its going to be a busy day for the stocks and one can expect sharp moves.

    Updated model performance is given below:


    Monday, April 27, 2015

    Model Update - April 27, 2015


    Market action today was more of sideways gyration. Dow Jones industrial average is completing its inverted head and shoulders pattern. Hence, we are seeing the back and forth. However, one must remember that market is about to enter traditionally weak time of the year, with sell in May phrase about to start making round in the financial news channels.
     
    Under such circumstances, its possible for market to decline a little. This will be a good time to test the model and see how it behaves in a historically weaker period for stocks.
     
    Today, model lost 0.75% vs 0.23% in DJIA.
     

    Saturday, April 25, 2015

    Lessons from Nasdaq and Beating the Market

    Last week was a positive week for the overall market. Blue chips gained some but Nasdaq gained a lot. Nasdaq is now within few points of all time high, which was set in 2000.

    Although Nasdaq (the darling of 90s) is now approaching all-time highs after 15 years, many of the companies that were making higher highs in early 2000 are no where to be found in today's market. If one had invested in selected few companies, he would still be at a much lower level.

    The story of Nasdaq taking 15 years to reach its all-time highs, teaches us two important lessons:
    1. Market can remain below a certain level for eons. Therefore, buy and hold might not be the best strategy
    2. Individual stocks are extremely hard to manage because of their individual unique profiles, company cultures and other aspects
    Being said that, now the question arises how can one then beat the market and should one hire a money managers, with ton of market experience, to beat the market. Lets tackle both of these questions one by one:

    Firstly, over the long-term (~20 years) only 1-2% of the money managers beat the market. This means that the probability of selecting a winning manager is .02. In other words, if you have the choice of investing money with 100 money managers, only 2 will be able to beat the market over the long-run. Furthermore, all of them will take money management fees. So should one invest with money managers with such low odds of success?

    This observation gives credence to Warren Buffet's concept that its better to invest in low cost ETFs that follow the market and at least perform better than majority of the money managers because you will be closely following market's performance. But this method does not answer the question of how to beat the market. Although it is a difficult question to answer, it is a very good question to ask!!

    In order to beat the markets, one should buy good companies and ride them as long as they perform well. If they enter a bear market, one should start riding another well-performing company. Although this concept seems very simple, it is very difficult to implement. In order to effectively implement this concept one needs following 5 pieces of information:
    1. Which companies to invest in?
    2. Whether selected stock is in a bull or bear market?
    3. How much to invest in each position? 
    4. When to exit a certain position?
    5. How to protect gains? 
    As you know Understand, Survive and Thrive has been performing market analysis over the past several years with the goal to optimize portfolio returns using objective techniques and algorithms to take out emotions from trading. We have recently tried to incorporate above mentioned 5 pieces into our model for long-term investing.


    Sunday, April 19, 2015

    Weekend Market Review - Week of April 20, 2015

    Last week market declined with Dow losing more than 1% in a week, with Friday being the worst day of the week. Although the decline was pretty severe on Friday, one can regard the overall market action has sideways gyration. Over the past few weeks, there hasn't been any clear direction for the market and therefore, its like that the market is setting up a base before the next breakout. However, there is a lot of news on the deck that could keep this market gyrating back and forth, before it sets the direction.

    Next week will bring another deluge of earnings, which would keep the market participants on their toes, itching to press the trigger. Very basic instinct of any trader is to buy on good news as the stock rallies and sell when it is confirmed that things are going south. However, by the time it is confirmed with financial results that stock/company is doing poorly, a forward looking company management already implements policies to bring the company back on course. As a result, many stocks turn around and maintain their bull trend, as soon as bad results are announced.

    This behavior gives birth to the concept of portfolio re-balancing and riding the trend. It means that as long as an individual stock is in a bull market, it will continue to rise and give way to more growth. In this regard, if one can identify the following traits, they can be very successful:

    1. Which stocks to invest in
    2. Whether selected stock is in a bull or bear market
    3. How much to invest in each position 
    These three characteristics, along with few other key contributors can allow an individual to beat the market without even paying daily attention on their portfolio. This concept is the result of 5 months of exhaustive research and will discuss it in more detail in future.

    For now, market is in a long-term bull market. There was a scare but it has been dealt with. Technically speaking, market is carving out an invested Head and Shoulder pattern which, when complete, could provide a foundation for another rally. We will re-evaluate the situation on a decline below 2500 (Global Dow).


    Saturday, April 11, 2015

    Market Update - April 11, 2015

    The stock market grinded higher most of last week as SP500 closed higher four out of five days. The lack of any sharply higher days has kept the bullish enthusiasm at relatively low levels.

    The earnings season hits full stride next week with 15 companies reporting next Tuesday and 46 on Wednesday. The season peaks on April 30 when 392 companies report. The continued lowering of earnings expectations may end up being a positive as very weak numbers may already be factored into some of the beaten down stocks.

    As of now market seems healthy. Bears had there chances in March, but now its time to see how bulls fight back.

    As mentioned few months ago, UST team was working on a unique asset allocation model to capitalize on stocks in a bull market, staying with the trend and minimizing the trades for effective portfolio management. Although we will discuss the model is greater detail in future, the model has been in use since November and results seem promising.