Twitter

Showing posts with label analysis. Show all posts

Tuesday, March 28, 2017

Financial Media and Stock Market

Over the last week, Financial News media is talking about how Trump will not be able to keep his promises given current political situation. Hence, continuation of the "Trump Rally," as it has come to be known, is in jeopardy. However, this is not correct and this is my problem with the media. News media needs a story and reports on everything after the fact because that is what majority of their readers can relate to.

They have done the same thing over and over again. Three big examples from 2016 include Brexit, US Elections and Oil crash of early 2016. In case of Brexit and US Elections, media did not have clue of what will happen in the actual vote. Everyone was complacent about status-quo remaining intact and no changes taking place. For example, UK staying in EU, while Hilary winning the White House.


Once both of these predictions turned out to be wrong, they focused on how negative will this development be for the overall stock market because of nationalistic policies, lack of growth and other issues. However, the market proved them wrong every time. And then they cam up with rational behind Trump rally or Post-Brexit stock market rally. These reasons range from additional liquidity by central bankers or business friendly presidency.

Brexit
US Elections
However, if you think about it for a minute, what would have happened had we seen the opposite results in Brexit Vote or US elections?
  • Brexit Vote: A vote to stay as part of EU would have also triggered a stock market rally but the rationale would be - it's a relief rally!
  • US Elections: A vote for Hilary Clinton would have also triggered a market rally with a rational of policy continuation and lack of uncertainty  
In either case we would have experienced higher prices but different rational. Therefore, financial news media had no idea regarding the cause of the rally and didn't know that the market would rally. They just react to market performance and come-up with justifications. If one had been following the financial media and acting accordingly, they would have lost a lot of money or at least had not participated in the market rally.

And right now, media is so focused on negative aspects of Trump administration that it is missing several opportunities. We discussed some of these opportunities, as part of our 2017 investment themes in February (link).

In order to mitigate this news driven emotional roller-coaster, we developed proprietary portfolios, where investors can invest for longer-term consistent gains without involving emotions due to financial news media. For example, we exited the stock market in Sept 2015 and then entered the market again in July 2016, and have maintained long positions since then.

Following is an overview of the performance. Detailed performance will be shared after end of Q1:
  • Conservative: ~7.5%
  • Aggressive: ~18.5%

Want to Invest?

At Understand, Survive and Thrive, our goal is to produce consistent, uncorrelated returns using unique analysis techniques, that will enable your portfolio to beat the market over any economic cycle and provide peace of mind. We don't believe in beating SP500 every single month. And therefore, if someone wants to try our strategies just for the short-term, we will suggest that they will be disappointed at some point.

If you are interested in investing, you can register below and we will send an update. Some of the key outputs from the data models used in this strategy are also available through subscription.

Wednesday, November 2, 2016

Market Trend Remains Up

Sideways consolidation continued over the last week. The blog wasn't updated because of registration paperwork. We will discuss Investment Advisory registration in one of the upcoming posts.

Markets' sideways action remains intact. Even though in the last couple of days SP500 and US indices saw a relatively sharp decline, it did not impact the overall shape and form of the market.

Market Structure
SP500 is tracing out a diagonal pattern (shown below). One of the criteria of this pattern was to decline below C level, which it did yesterday. Now, the market needs to hold above yesterday's bottom to confirm that this pattern has been completed.


The overall market structure remains very choppy. This choppy action now spans over 4 months, which is a good enough time to correct the market through time. At weekly level this sideways action looks nothing more than a bull flag or pennant formation. And both of these are bullish in nature.


In terms of next market move, there are couple of options and will be determined by how the market participants react to the next rally phase. In either case, the minimum rally requirements would be above July 2016 high or around that level (SP500 = 2190).

Sentiment
Recent decline has also improve sentiment measures to suggest that a more sustainable rally is possible.

Fear/Greed indicator is at levels where it typically signifies a market bottom.

Similar another indicator just generated a buy signal and could mean that the trend is about to turn to the upside.


Market Classification Model:
MCM for stocks continues to be in a bull market. Therefore, the trend remains up and we will soon see a sharp rally. Even with yesterday's sharp decline, our strategy performed well. While SP500 was down 0.72%, we were up 0.20%. Another proprietary model is suggesting a sharp rally in our strategic allocation portfolio. We will see. So far by the grace of almighty, our proprietary portfolio is up ~20% YTD (after 10 months), which SP500 is up ~6%.

 If interested in free e-mail list or in paid services, please fill-out the form below.


Saturday, October 22, 2016

Sideways Gyration Continues...

For more than 3 months markets have been going sideways. This sideways action is not only boring, its very straining for investors, economists and everyone else. As market goes sideways, investments don't yield returns which frustrate investors and they try to do things that more often than not hurt them. It's a way of market to throw us off our investment strategy. But the goal is to be not be dissuaded by the market and keep following a plan.

Along side regular investors, it significantly impacts options traders. Sideways market action is disastrous for option premium. As a result, options expire worthless. SP500 is currently at the same level as it was in early July. So over last 3 months, market has not gone any where.


If anything, it has a slightly downward trajectory since August. On one hand, this kind of market action is positive for long-term market gains, as market is digesting gains and will most likely breakout, it begs the questions whether we have seen the bottom or market still needs to do some work on the downside.

We are blessed to be up ~20% (YTD), while SP500 is up ~6%. Detailed performance analysis will be shared at the end of the month.

Identifying Next Market Move
Identifying a top or bottom remains a very difficult job. In order to correctly project market's next move, we need to take into account 4 items:
  1. Timing
  2. Structure
  3. Market Signal
  4. Confirmation
Without all of the above items lining-up, its premature to assume that trend has reversed.

Timing
In regards with market timing, we are currently within the Inflection Point Model's turn window. Window is shown above in blue box and is shown below:
Turn window will expire at the end of next week.

Structure
Market structure remains corrective but there is a potential that we can see a decline before sustainable rally. Therefore, if the market rallies and can sustain the rally, it will be signal of bottom. If the market cannot sustain the rally and starts declining in the next couple of days, it will suggest more work is needed on downside. 

Market Signal
If market performance over the next few days generates a technical signal, it will show us whether market will top or bottom within this turn window

Confirmation
Once the trend is set, we would need a confirmation by proprietary levels to confirm the move.

Conclusion
Market remains in a sideways pattern. This pattern will soon end but will confuse many market participants along the way. At UST, we know that the market is within a turn window, now we just need to wait for a market signal and confirmation to confirm the next move. 

Overall, market remains in an uptrend. And in the next post we will see the value of adhering to Market Classification Model. We will also be writing a series of posts on how our proprietary strategy fared in a confusing sideways market. This will be an amazing case study and I am thankful for the fact that we have seen this kind of market action because it will enable us to see the benefits of certain key aspects of our strategies.

If interested in free e-mail list or in paid services like Market Classification Model, IPM or others, please fill-out the form below.

Tuesday, August 23, 2016

Portfolio Performance - August 23, 2016

Last few weeks have been extremely slow for the market, and also for our proprietary portfolio. Following chart shows the performance of SP500 in relationship with our portfolio.


Some of the key observations are:
  1. SP500 (total return) is up +0.62% MTD, while portfolio is down -0.5% for the same period
  2. Model has been consolidating in a very tight range, which means a break is coming
  3. SP500 is also stuck in a very tight range with a slight upwards tilt
  4. Historically, model's performance has been uncorrelated to the market with upwards bias. If this continues, we should expect a break-out in the near future

Portfolio Overview
At a time when stock market has not performed well, and has caused a lot of anxiety among investors, our prop investing strategy has out performed the market in all aspects:
  • Volatility - Historical testing shows that model has 8% standard deviation vs 16% for SP500
  • Sharpe Ratio - Historically, model has a sharp ratio 2.5+
  • Beta - Current weighted average Beta based on portfolio components is 0.32
And above all, model is positioned to take advantage of the next market move. Therefore, it enables one to relax and invest with confidence. 


Market Action and upcoming events
There are genuine reasons for current market calm e.g. August is a slow month and also people are awaiting Fed action. By some measures optimism among investors has reached levels where it has resulted in market declines. We think that market structure, IPM turn window and extreme in sentiments will give way to a sharper decline in the stock market after Labor day, once people return from vacation.

However, it won't be a reason to sell the market. The time to sell is now, if you want to. That will be time to buy because the trend remains up. Following the bull market is one of the most critical things an investor must do. Staying long in a bull market pays dividends in the long-term. At UST, we stay aligned with the trend by following our proprietary Market Classification Model

A proprietary algorithm that classifies market conditions i.e. Bull market or Bear market. Currently, this model is suggesting a longer-term up-trend for the US Stock Market. For Subscription click below:

Monday, January 25, 2016

Portfolio Performance & Market Overview

Market remains in a bear market. Sharp rally of last weak as the feel of a bear market rally. Today's decline might be the start of next leg down. However, this leg might not be as long as what we saw in early January. In fact, once this phase is over, we could see a sharper rally, lasting for 2-3 weeks.

Although the above analysis is based on Elliott Wave theory, overall trend remains down. And till the time this trend turns up, we should remain cautious. Our portfolio allocation model exited long positions in August. And shorted the market at the start of 2016.

So far the portfolio is up ~5% (YTD) in comparison with ~8% (YTD) decline in the SP500. Another interesting aspect of this portfolio is that its "Beta - measure of risk when compared to SP500" is -0.56. 

Therefore, it is not correlated to the market. In a bear market, this portfolio mix not only allows us to gain from the market decline, but also enables us to protect ourselves in case of a sharp rally (like the one we saw last week).


This portfolio is an auto-allocation portfolio with diversity considerations to ensure protection against systematic risks. Asset class risk is managed by employing proprietary Bull/Bear identification mechanisms. We will keep tracking this portfolio on an on-going basis to see how it performs over the long-term. This portfolio can also be considered as the next step in our effort since March 2015 to automate portfolio management through advanced analytical and statistical tools.

As for the overall market, their is no change in the outlook. Stocks remain in a bear, while bonds remain in Bull market. There are some asset classes which have just entered a Bull market or are trying to carve not a base before entering the next phase (Oil is not one of them).


Tuesday, January 19, 2016

Stock Market Trend and Russell 2000

We have been discussing market and its down trend for quite some time at Understand, Survive and Thrive. It seems like this relentless downtrend doesn't want to end any time soon. Oil keeps on falling and keeps dragging the stock market with it. At some point market will rally but in a downtrend one cannot trust the rallies. In fact, hoping for a rally in a bear market is akin to hoping for a correction in a bull market.

Rallies will come but will be short and sweet. By the time people embrace them, they will be over and the primary trend will resume. One of the biggest red flag in current market is the significant under performance of Russell 2000. Russell 2000 is a small caps index and small caps are most impacted by changes in economic conditions because they are most sensitive to credit availability.

These business depend on economic growth and easy credit for their survival. Therefore, whenever you see small caps declining, its a major red flag.

In December, we highlighted that Russell 2000 ($IWM) was forming a head and shoulders topping pattern (link). The pattern looked like:


Now a completed pattern looks like following. This pattern still has another 7% decline left before it reaches its measured target level.


Small caps are already in official bear market, another 7% decline will bring the Russell 2K index in low 900s.

This analysis shows the importance of objectivity in investing and why trend following is critical. An up-trending market will find excuses to go up and a down-trending market will find fundamental and technical excuses to go down.

At this time, long-term trend in stocks is down. So every rally attempt should be treated with caution. Downtrends implication are very severe on the economy. We might be headed for a recession. Junk bonds and oil related bonds are doing poorly. This could be another area of serious concern. We will continue to evaluate the situation. But the bottom line is the best portfolio right now will be a portfolio who beta is lower than the SP500. Lower beta would reduce your risk in a down market and will allow you to preserve capital.

In the next few blog posts, I will share our portfolio which is a -0.56 beta and is beating the market since the start of the year.

Sunday, February 16, 2014

IPM Model Update & Gold Breakout

IPM Model Update Has Been E-mailed to Subscribers.

IPM Trade Matrix Updates: IPM Trade Matrix Update - Trade 5 (Part 4)

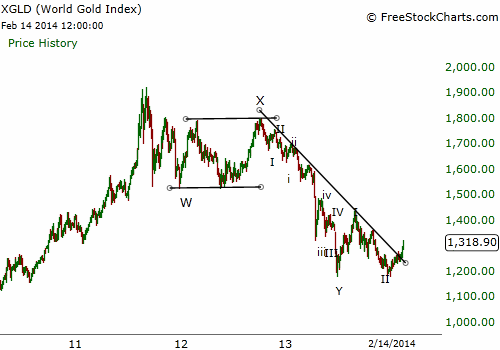
Gold & Silver are breaking out. There are several reasons to be optimistic about their prospects:
  1. 8/4 Test has been completed to the Upside in both Gold and Silver on both dail and weekly time frames. This suggests that the trend has reversed, and we should start looking for upside surprises. 
  2. Long-term trend lines have been broken to the upside.
  3. Sentiment had reached pessimistic extreme few weeks ago, which was in line with a generation precious metal bottom
  4. Bottoming process took its due course which is encouraging for the market
  5. Miners have really started out-performing the metal. This is another exciting and encouraging sign.
  6. Rally from the bottom has been impressive, and suggests a new trend has started.


Confirmation of a new Bull market will be a rally above 1460 in Gold.


For Blog updates on Google+ add: Understand Survive Thrive 
For Blog updates on Twitter, add: @survive_thrive
For E-mail updates: