Twitter

Wednesday, December 18, 2013

Very Interesting Point in Markets

Markets rallied very sharply today. This is in line with the IPM Model analysis that was sent to subscribers.

However, it gets very interesting at current levels. Today's rally came on the heals of Federal Reserve's tapering decision. Ben initiated the tapering processing before he left, so that Janet doesn't get the blame for tapering. And Janet can continue with tapering over the coming years.

Pretty much everyone knows that tapering could be bad for stocks. And in response stocks staged a nearly 300 point rally, which took many market participants off-guard. However, there are several reasons for concern about today's rally:


  1. Rally did not trigger breadth based buy signal, which is bad. This means we will not see a long lasted rally phase.
  2. There is divergence between DJIA and DJ Transportation average
  3. SP500 is still below December 9th peak
  4. Russell 2000 did not rally as aggressively as DJIA
  5. Weekly IPM Top is still in play, till new high is made
  6. Next Daily IPM Turn date suggests that we will soon see further decline in the market
  7. MFI based timing model also had a sell signal during 12/9/13 top.
  8. Elliott Wave analysis suggests that we just saw a wave 2 rally, which will be followed by a persistent wave 3 decline. This decline could last for several days (if unfolds).
  9. Global Stock Markets are declining. Some markets like FTSE 100 have entered a bonafied down trend by completing the 8/4 Test on a weekly time frame.
In conclusion, today's rally might be a classic bull trap. This assumption will be invalidated by a market rally above 12/9/13 top in several markets such as Russell, SP500 and DJ Transports.


Sunday, December 15, 2013

IPM Model has been E-mailed to Subscribers

Subscription will be temporarily closed in January 2014. It might re-open in 2014.

Monday, December 2, 2013

IPM Model Update has been e-mailed to Subscribers

Note: Subscription might close in January. At that point, only current active IPM Model subscribers will keep on receiving IPM update. There is no timeline as to when IPM subscription will re-start.

Tuesday, November 26, 2013

Happened As Predicted

Like predicted market rallied into low 1800s from 1778. Short-term market correction will be based on the IPM Model turn window, which has already been emailed to subscribers. Market would decline and go sideways till the net IPM Model turn window comes in December.

Detailed analysis will be published later on.

Wednesday, November 20, 2013

Fed Minutes on the Horizon

Divergences continue to roam the land. These are dangerous signs. I have been highlighting these for the past month or so. And now the Weekly IPM Model turn window will soon take effect. Therefore, we are entering troubling timing times.

The only things going for the market are seasonality, unfinished market structure and holidays sales. As for the IPM Model daily turn window, one should use it in conjunction with weekly IPM turn window. Please note that daily dates get skewed near weekly turn dates. In other words, we should develop a risk-management mechanism, keeping in mind that risk has increased.

As far as the market structure is concerned, yesterday's market action has clarified the wave count. We are currently in wave 4. This will be followed by another rally. Rally target will be in the low 1800s. This target will be achieved during the daily IPM Model turn window, and will be followed by another correction.


This scenario will be violated if the market declines below 1763, and risk will increase if the market declines below 1773. We will also get Fed's meeting minutes today. So this might be the catalyst, which pushes the market to new highs. We will see...


Tuesday, November 19, 2013

Market Overview and Elliott Wave Structure

Market declined yesterday, and the reason given by the mainstream media was one of the most absurd reasons I have heard in a long time. Headlines on CNBC suggested that market declined due to some remarks from Carl Icahn. This head line was not only unbelievable, it highlighted the fact that mainstream media really does not know what they are talking about.

My question is, if the markets are to react this much based on an investors comments, is there even any point in analyzing these markets any more? The answer that I have is that Carl Icahn's comments had nothing to do with yesterday's sell-off. His comments were used as a justification for the sell-off because media outlets did not have anything else to cover at that point in time.

As a result, I did an Elliott Wave analysis of the market to understand where we are, and where the market should be heading in the near future. Please keep in mind that IPM Model Top date is suggesting further rally.

Following chart shows SP500's near term wave structure. According to this wave count, yesterday's market decline was a sub-wave 2 decline. It will be followed by a sharp rally. The problem with the sharp rally scenario is extreme optimism in the market, as evident from low Put/Call ratios. In order for the sub-wave 2 scenario to take place, market must start rallying soon. If the market keeps on going sideways, market will be in wave 4, not wave 2.

Critical level for Wave 2 is 1773.
Critical Level for Wave 4 is 1762.


Another reason, why I am leaning towards the wave 2 scenario is because the rally from October low to October end high added more than 100 points. That was the 1st wave of one larger degree. IF we are in the 3rd wave of that degree, rally should be comparable to Wave 1. That leads to a target of 1840 in the market. 1840 target can be attained by the 1,2 - i, ii scenario.


SP500 futures are sporting a similar pattern. 


Only Russell 2000 future's pattern is slightly different i.e. we can count completed 5-wave sequence from the November 9 bottom.  This would mean that market might have a deeper correction and then rally. However, deeper correction should not very long in order for this rally to meet IPM Model top date.


In summary, markets are currently undergoing a classing Elliott Wave correction. 
  • If we are in 1-2, i-ii wave sequence (shown above), this correction should be short lived. 
  • If we are in wave 4 of 3, correction could last for few days. This is a less likely scenario because the October rally (wave 1) was a sharp and long rally. Wave 3's are comparable in length to wave 1 (can be a little shorter in length). 
  • Futures are supporting the same pattern, and are in line with the IPM Model turn date.
  • SP500 Critical levels: 1763 and 1773   
This analysis shows that market analysis is an art, and one should not believe on mainstream media's news reports to make investment decisions.

Note: IPM Model has been e-mailed to subscribers.


Monday, November 18, 2013

IPM Model Update E-mailed to Subscribers

According to IPM Model there is a very high potential that even with all of this bubble talk over the last few weeks, markets will continue to rally for another few weeks. Details timing information has been emailed to subscribers.

By the grace of God, the IPM Model has accurately predicted 95% of the major turns in the past year. Most recent example is at:

IPM Model Readings


Monday, November 11, 2013

In Remembrance of Imam Hussain (Son of Ali)

Understand, Survive and thrive will remain dark till Sunday, November 17, 2013 to commemorate the in-humane slaughter of Hussain in Iraq, 14 centuries ago. Thursday November 14 is the 10th of Moharram.

A Britain based report indicates that skies wept blood for Imam Hussain everywhere:

"685. In this year in Britain it rained blood, and milk and butter were turned into blood." (The Anglo-Saxon Chronicle, Translated, edited by G. N. Garmonsway, Professor of English, King's College - London)

The year 685 AD is the same year in which Imam Hussain was martyred.

Quotes about Imam Hussain by famous people:


Mahatma Gandhi: (Father of the Nation - India)
“I learnt from Hussain how to achieve victory while being oppressed.”
"My faith is that the progress of Islam does not depend on the use of sword by its believers, but the result of the supreme sacrifice of Hussain.”
“If India wants to be a successful country, it must follow in the footsteps of Imam Hussain (R.A)."
“If I had an army like the 72 soldiers of Hussain, I would have won freedom for India in 24 hours.”

Thomas Carlyle (Scottish historian and essayist)
“The best lesson which we get from the tragedy of Karbala is that Husain and his companions were rigid believers in God. They illustrated that the numerical superiority does not count when it comes to the truth and the falsehood. The victory of Husain, despite his minority, marvels me!”

Charles Dickens (English novelist)
“If Husain had fought to quench his worldly desires…then I do not understand why his sister, wife, and children accompanied him. It stands to reason therefore, that he sacrificed purely for Islam.”

Sir William Muir (Scottish orientalist)
“The tragedy of Karbala decided not only the fate of the Caliphate, but also of Mohammadan kingdoms long after the Caliphate had waned and is appeared.” (Annals of the Early Caliphate, London, 1883, p.441-442)

Antoine Bara (Lebanese writer)
“No battle in themodern and past history of mankind has earned more sympathy and admiration as well as provided more lessons than the martyrdomof Husayn in the battle of Karbala.” (Husayn in Christian Ideology)

Pandit Jawaharlal Nehru: India’s 1st Prime Minister
"Imam Hussain's sacrifice is for all groups and communities, an example of the path of rightousness."

Edward Gibbon (English historian and member of parliament)
"In a distant age and climate the tragic scene of the death of Hussain will awaken the sympathy of the coldest reader."
[The Decline and Fall of the Roman Empire, London, 1911, volume 5, pp391-2]

Rabindranath Tagore (Indian Nobel Prize in Literature 1913)
"In order to keep alive justice and truth, instead of an army or weapons, success can be achieved by sacrificing lives, exactly what Imam Hussain did."
“Imam Hussain (R.A) will warm the coldest heart.”

Dr. Rajendra Prasad (1st President of India)
"The sacrifice of Imam Hussain is not limited to one country, or nation, but it is the hereditary state of the brotherhood of all mankind."

Dr. Radha Krishnan (Ex President of India)
"Though Imam Hussain gave his life almost 1300 years ago, but his indestructible soul rules the hearts of people even today."

Swami Shankaracharya (Hindu Religious Priest)
"It is Hussain's sacrifice that has kept Islam alive or else in this world there would be no one left to take Islam's name."

Sarojini Naidu (Great India Poetess titled Nightingale of India)
"I congratulate Muslims that from among them, Hussain, a great human being was born, who is reverted and honored totally by all communities."

Market Overview and Future Direction

I would like to start by thanking God for the accuracy of the IPM Model because "Trying is Human, Result is God."

IPM Model doesn't seize to amaze us with its accuracy. Latest example in this regard was the latest stock market action, as witnessed over last 2 weeks. Without going into much details, the IPM Model not only predicted that a top would occur on 11/1/13, it also predicted the bottom scheduled for 11/11/13. (+/- 4 days)

The most amazing part of this prediction is not the accuracy, but how all the Market Matrix signals came together to generate a buy signal, right around the turn dates. For example, Elliott Wave structure was completed on 11/7/2013 to mark the end of market correction. This structural completion was accompanied by market buy signals. Since this happened in an uptrend, there was no reason to doubt the long-side. This took on even more importance because over the last week a lot of investors and traders started to leave the market because of extreme optimistic readings from newsletter writers.

Since this is not the first time the validity of the IPM Model has been confirmed by the market action, UST team will be publishing 3 White papers to better understand the IPM Model and its history:

  1. Stock Market Timing and IPM Model
  2. IPM Model and Performance Overview
  3. IPM Market Trajectory Library and Trade Matrix


As for the boarder market, recent optimistic extreme does not bode well for the long-terms prospects of the overall stock market. In fact, it is quite possible that market might top-out during the upcoming weekly IPM Model turn date (date emailed to subscribers).

Following chart highlights the Elliott Wave structure of the global stock market index. According to this chart, there are still few rallies left in the market. The question again is: WHEN will it complete? And my guess is that it will be around the upcoming weekly/daily IPM model turn windows.


Recent Posts on the Market Action:

  1. Rally Continuation Target
  2. Elliott Wave Analysis
  3. Implication of Divergence on the Broader Market
  4. Market Topped as Expected. Now What?

Overall, market is getting stretched to the upside and danger signs are appearing:

  1. Extreme optimism
  2. Divergence between U.S. stock market and the housing/real estate sector
  3. Divergence with certain leading markets

We need to evaluate these signs on a regular basis to understand market risk. In the event, it might be pertinent to mention that UST predicted the start of a new bull run in the global stock market in November 2012. Since then we have seen 26% gain in a year and are still in a Bull market. That call was amde possible by a proprietary market analysis technique.

At Understand, Survive and Thrive, we are continuously trying to improve our market analysis techniques and develop new analytic strategies, which can provide edge to the readers. These strategies will be introduced in the near future.

Note: Critical level is Thursday's low!

Sunday, November 10, 2013

Rally Continuation Target

Given that the market holds above Thursday's lows, market can rise another 4-5% till next IPM Model Turn window.

Next IPM Model turn window will be e-mailed to subscribers next week. Please note that the IPM Model turn window resulted in very good trades over the last 2 weeks.

Friday, November 8, 2013

Elliott Wave Analysis

Market is ready to head-up. Elliott Wave analysis suggests that the market structure is leaning towards a bullish resolution, even with optimistic sentiment.


Market should hold above yesterday's low. Yesterday, NYMO buy signal was also issued.

We will continue to evaluate market pattern, and decide on sell time appropriately.


Wednesday, November 6, 2013

Implication of Divergence on the Broader Market

U.S. stock market has been performing very well for the past 4 years. In fact, this is one of the fastest/least loved Bull markets in the history of the U.S. indices. It is not loved because people continuously doubt it due to divergences that appear from one sector to the other sector. These divergences can through-off investors from looking at the primary trend. Thus, creating a wall-of-worry which bull market can climb. 

Some of the biggest examples of these divergences since 2009 include:
  • The divergence between unemployment rate and stock prices
  • The divergence between housing recovery and U.S stock market rally from 2009 to 2010. 
Therefore, divergence themselves are not a reason for concern, but are rather something to look at and keep in mind for clues about up-coming trend.

As far as the overall market is concerned, we have been hearing a lot of talks about another stock market bubble. This bubble is attributed to several high-flying tech names which are rallying like late 1990s. Twitter IPO is another much hyped entry into the stock market, which is increasing fears about the presence of a bubble. And the reason behind this bubble is linked to Fed's ultra-accommodating monetary policy.

Another sign of a potential tech bubble is that last year Harvard Business School's MBA class heavily favored to join start-ups in comparison to Wall Street. This highlights the extreme lure that these companies are carrying at this point in time. 

Although sharp rise in high-flying stocks is a source of concern especially at a time when economic mainstay industry like housing sector is diverging from the broader indices, it does not guarantee an immediate decline in the stock market. We might be right 2 years from now, but stock market investing requires accurate timing aspect, if one wants to make successful investments. Furthermore, bubbles typically do not pop when everyone is looking out for them. They pop when the majority embraces them. And according to a latest research, wealthiest Americans have not embraced the stock market bubble. In fact, they are still cash heavy in their portfolios.

In regards with market timing and next move, it appears that market has enough juice left even with all of the above concerns to make new highs. Seasonality is in favor of higher stock prices at least till next year. UST team has already published Weekly and Daily IPM Model turn dates for subscribers. These dates would be very interesting because it seems like the market is getting ready to rally into these turn dates. 

A rally into these turn dates would help further develop the case for market divergence. And by that time bubble discussion might subside giving way to mainstream acceptance of the high-flying tech stocks. At that point, it will time to become scared. 


Tuesday, November 5, 2013

Real Estate / Housing - Ominous Divergence!!

Housing industry is the mainstay of the U.S. economy. Without robust housing recovery it will be difficult to sustain a robust economic growth in the U.S. Housing industry fuels a lot of jobs and allows financials to rally. Financial stocks are heavily dependent on the housing sector because loans made out to home-buyers yield significant profits. Moreover, credit rotation in the U.S. economy is primarily governed by the housing and real estate sectors.

Therefore, whenever the housing and/or real estate sector starts to under perform, astute investors take notice. We are in one of these times, where housing and real estate ETFs like ITB and IYR are lagging the market. This can be a dangerous sign for the overall economy.

At Understand, Survive and Thrive, housing sector's warning signs were documented in great detail in August 2013. Following articles were published in this regard to warn about potential housing risk, and to not get overly bullish about investing in this sector:

  1. Is Housing About to Take a U-Turn: Road to Recovery to ...
  2. Housing Market - Near Term Picture
  3. Housing Market - Down Trend Resumption
  4. Real Estate Market - End of Recovery?
  5. 2009-2013: Real Estate and Housing Rally Analysis

Since then SP500 and DJIA managed to make new highs (as predicted by the daily IPM model in late August). But housing and real estate sectors have been diverging from the broader U.S. indices since May. This is a dangerous sign for the broader U.S. stock market.

Housing ETF - ITB 
Real Estate ETF - IYR

SP500
A similar divergence was seen before the 2007 stock market peak. At that time, housing sector started lagging the broader indices since early 2007. Finally this divergence caught up to the broader stock market, and SP500 / DJIA topped in October 2007. This top was followed by nearly 50% plunge in stock prices. Following charts show the divergence as seen in 2007.


There are several reasons why this divergence should be taken seriously:
  1. Housing sector is a very economically sensitive area. It foretells upcoming credit conditions, buying power of the consumers and consumer confidence in the economy. If it starts lagging behind, it typically means that the economic under-currents are not very strong i.e. consumer demand and buying power is waning. Since consumers derive U.S. economy, dwindling consumers is a bad omen for the overall economic growth
  2. Housing sector's growth trickles into numerous industries. And therefore, a slowing housing industry could be a bad sign for several peripheral industries.
One very interesting aspect of the 2013 ITB (Housing ETF) and IYR (Real Estate ETF) is that both of these sectors topped exactly during the weekly IPM Top date. This date was emailed to subscribers in May. Since topping in May, these sectors have only managed to make lower highs so far. Moreover, another weekly IPM Model Turn window is approaching (dates emailed to subscribers). So the big question is: Is this sector going to make a lower high during the upcoming Weekly IPM Turn window. A lower high in a turn window, typically foreshadows a Bear market!!

Although these divergences can resolve themselves with a sharp rally in the housing stocks, we need to keep these in mind till the time they are not resolved. However, trading decision should not be purely based on a potential divergences because a divergence does not typically materializes till the broader stock market index follows to the downside. Therefore, trading decision should be based on your own methodology, along with other indicators like IPM Model turn windows. In the next update, we will evaluate this divergence in relationship with the broader U.S. market to analyze the possibility of SP500 making a new high even with this ominous divergence. 


For quick updates, Google+: Understand Survive Thrive

To subscribe to IPM Models and special reports:


Saturday, November 2, 2013

Market Topped as Expected. Now What?

So the market topped once again within the IPM Model turn window. Now the question is that whether this Top will be a temporary top, followed by another rally to new highs? Or will it be the start of a major correction?

As far as the current IPM model update is concerned, it was stated in the last post that there were two IPM model turn dates namely at 11/1/13 and 11/11/13 (+/- 4 days). 1st Turn window (11/1/2013 (+/- 4 days)) was scheduled to be a market top. And so far, it has turned out to be an accurate prediction.

Market action following current turn date will be governed by the market trajectory library. IPM Model's next turn date, after 11/11/13, is scheduled to be a market Top and is a significant turn date because it coincides with the Weekly IPM Model turn date (both of these dates will be emailed to subscribers). Therefore, it is likely that current correction will be short-lived and we will soon see new highs.

In other words, 11/11/13 turn date should mark a market bottom. Bottom picking will take place in conjunction with proprietary indicators.

At this point in time, I would like to mention that IPM model has accurately predicted multiple market turns for years now. In fact, IPM model is being used by Understand, Survive and Thrive for almost 3 years, and its accuracy in market timing can be regarded as second to none based on my personal experience of 5 years of trading the markets (since 2008). As a result, a white paper will be published on the effectiveness of the IPM Model over the coming week, and several trading models will be introduced based on the IPM model.

As you might already know, market analysis is a probabilistic art and requires persistence with edge. IPM model provides the type of edge that an investor needs in order to perform well in the markets. IPM model's prominence significantly increases as it has three feature, which other market timing models do not have:

  1. It provides investors with the exact date that a turn will happen
  2. It provides us the nature of the turn before hand (Top or Bottom), which allows an investor or trader to position their trades accordingly
  3. It tells the next IPM model turn date and nature. This would allow the market participant to understand the market trajectory over the next few weeks.

Understand, Survive and Thrive team has developed a market trajectory library to encompass all possible market trajectories between the two turn dates so that it is easier for subscribers to understand the up-coming market action. Furthermore, UST team has also developed a market trading matrix based on the IPM model turn dates. IPM trade matrix will be used to layout trade plan for November.


Monday, October 28, 2013

IPM Model Readings

Software is working again and I am back from my trip. Following is the latest output of the system. 


Detailed analysis will be emailed to subscribers soon.


Wednesday, October 16, 2013

Up, Up and Away!!

Financials are ready to break out. Earnings season has started.

Financials have been consolidating for the past few months, since May. From May to October, 5 months of consolidation have refreshed financials. They can now rally, along with the rest of the market.


Rally might extend to weekly IPM Model top date.


Tuesday, October 15, 2013

IPM Information

As I am on international travel, IPM Model software is not working. I am trying to resolve the issue. Update will be sent to subscribers as soon as possible.

Tentative
Next turn date = Top, 
New high after last IPM Top Date October 7 => Continued rise
There is a high potential of a rally till end of October

Thursday, October 10, 2013

Tomorrow will be a Big Up Day but then...

It is getting very interesting. I think, I finally have a good understanding of the market's Elliott Wave structure. And according to this structure, we might one more high before the Top is in.

Can that Top today? This is the big question!!

Is this a Chance to Go Short or Long??

Its a very confusing time for trading. On one hand there is discussion about potential resolution of the debt-ceiling and government shutdown issues. And on the other hand, there is a confluence of technically time-tested indicators suggesting that there is a significant potential of market decline ahead.

From a Bull Perspective:
  1. It is difficult to quantify the decline from an Elliott Wave perspective. Whenever such situation arises it begs the question whether recent decline was only a sideways correction. And from an Elliott Wave perspective, it seems like a sideways correction. Therefore, we should be expecting further rally.
  2. Today, we are also hearing about potential resolution of stalemate between congress and the president.  
Bear Perspective:
  1. Trend has turned down in DJIA
  2. IPM Model top window is at hand. IPM model turn window has a success rate of 90%+.
  3. One of the indicators (very good success rate) is suggesting continued decline
  4. Lower high within IPM model top window is always a bad omen. Results in a downtrend 95% of the time.


Therefore, it is one of those times where we should let market decide its direction. If I am to take a guess, I would go with further decline. But in any case, we should make a trading plan to eliminate risk from trading. And for current trading plan:

Go Long: If market goes above XXX, after xx October. Rally might continue till next IPM turn window (will be emailed to subscribers).

GO Short: If market goes below YYY, by xx October. Decline will resume for next few weeks.


Wednesday, October 9, 2013

September IPM Model Update Review

On September, the IPM Model update predicted the following (Link to Document):

Scenario 1: Market Rises with brief Sideways Action & Tops around 10/7 (High Prob.)
Reasoning: Above mentioned fundamental reasons are very well known. And therefore, many 
people will stay away from the market during this time because market likes to fool the 
majority. Furthermore, wars are typically declared in a bear markets, not near all-time highs. 
Therefore, there is a very high likelihood that no strike will happen against Syria, & markets 
will rise till next earnings period with intermittent periods of sideways action.
Critical Level: Close below 1640 (Friday’s low).

In retrospect, all indices followed this road-map except for DJIA. DJIA had issues with re-configuration of its components. 

September had 4 turn dates (2 major and 2 minor):

TURN WINDOW (AUG 30 +/- 4 DAYS): Marked the Bottom at 1628
TURN WINDOW (SEPT 10 +/- 4 DAYS): Marked the top
TURN WINDOW (SEPT 27 +/- 4 DAYS): Marked the bottom for re-entry purposes in Russell 2000/Nasdaq
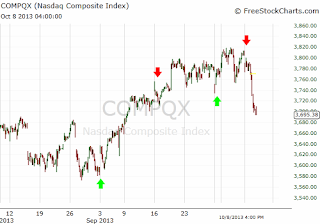
TURN WINDOW (OCT 7 +/- 4 DAYS): Marked the Top in Russell 2000 and Nasdaq 


Yesterday's decline was the sharpest decline that we have seen in a while!!

Now the question is, when will this decline end. The answer will be based on the IPM Model Turn Date & the next IPM Turn window status (Top/Bottom) in conjunction with Market Matrix analysis.

Tuesday, October 8, 2013

Market Decline Update!

So we have seen the market top per IPM Model top date (scenario 2), as mentioned in the last blog post. Today's decline is broad based and ranges from Russell 2000 to Nasdaq. Market top took place within the current IPM turn window (Oct 7, 2013), and during this top date SP500 & DJIA put in a lower high.

Now the question is when is the market going to bottom & has the trend changed? And is this time to go short?

According to IPM Trading model:

Short Trade in an Uptrend = If next IPM Turn window is a bottom. If next turn window is schedule to be a top then no trade

IPM Model update will be sent over the coming week, and will highlight the next IPM turn date & whether it will be a top or bottom. I will try to send it out earlier! 

Please note that bottoming signs have started to appear, and its possible that market might soon bottom with the earnings season / resolution of the Debt ceiling issue. We will use IPM trading model and the associated proprietary triggers to enter the long trade.

Sunday, October 6, 2013

Sideways Gyrations Continue!

With no clear message from the government to clarify the confusion related to Government Shutdown and Debt Limit, sideways market action continues. Futures are gaping down, but who knows by the time market opens Monday market, they might have reduced the gap down to zero.

In any case, at this point recent correction has lasted more than what was expected, and the buy signals are more than what were expected few days ago. This means that there is a higher potential of us reaching a significant bottom. However, since approaching IPM model is supposed to be a top, one of the following 2 scenarios might play out:

1- Market bottoms soon, starts a sharp rally. Pauses for few a days and then continues its rise
2- Market tops soon, and will decline sharply. Since DJIA has already declined sharply, topping scenario will best suited for Nasdaq and Russell 2000 and DJT.

In any case, I am writing this from JFK airport and will try to keep the blog updated while travelling abroad.

Thursday, October 3, 2013

Another Decline But Why Such Disorder??

So today markets declined yet again, it can be attributed to president's panic button or to relentless bickering in D.C. In any case, market was down sharply in the morning. Although it recouped some of the losses by the end of the day, it still ended sharply in red.

There are two interesting aspects of this decline:

1- Except for DJIA, there is no order in the decline.  Market is going up and down, with some indices near the highs while others near the bottom of the range. This kind of behavior is not consistent with a start of a strong down trend.

DJIA is showing a sharp decline since September 18 peak.

Russell 2000 is showing sideways market action since September 18.

SP500 is showing a sideways to down action since Sept 18 peak. 

Cumulatively there is nothing impulsive about these three markets and their declines, which suggests that we should consider this decline as a correction within a primary up-trend.

2- Over the last 2-3 days, we have seen panic coming back into the market. Sentiment surveys have started to show less optimism. Moreover, we have also received 2 buy signals from VIX and NYMO indicators. Therefore, this is suggesting that market correction is approaching an end.

Based on this analysis in conjunction with the IPM turn window, it is possible that market might be setting up for a stronger rally than what we had anticipated 1 week ago. If DJIA breaks below August lows then rally scenario will take a back seat. 

Wednesday, October 2, 2013

Obama Says That Wall St. Should Be Worried!! Should You Be?

After a long time, we have witnessed something amazing today: President of the world's only super power saying that Wall Street and investors should be worried about the prospects of the economy because politicians in the congress cannot get their act together.

http://www.cnbc.com/id/101081257

First, this kind of statement coming from a president does not make sense. Secondly, will it really impact the financial markets??

The answer for the time being is NO!! Markets like to fool the majority, as we have said multiple time on this blog. Political uncertainty is the perfect tool to make people distrust the economy for the time being. As this distrust increases, market will start climbing the Wall of Worry built on the foundation of political discord.

Overall, market remains in an uptrend. Following chart shows a clearly impulsive rise from August 30 bottom (IPM Model Bottom Date) to Sept 18 Top  (IPM Model minor turn date). Since topping on Sept 18, market has declined in a choppy formation and has corrected 50% of the rise. This suggests that the market might have just completed a correction phase, and it is ready for another leg higher.


As long as 1675 is held, benefit of the doubt will go to the Bulls and we should expect further upside. Going long makes even more sense right now because this is the most difficult trade in the face government shutdown and political bickering in D.C.

Note: Next IPM Model turn date has been emailed to subscribers. IPM Model turn date can be used to time market entry and exit points.
  

IPM Model Update Emailed

IPM Model update has been emailed to subscribers.

Extract from IPM Update:
"In the last update it was stated that “There were three turn windows, and therefore, one should be careful.” It also mentioned that “there is a high probability of continued market rise till October 2013."


At that time no one believed in a sustained rally because of: Fed’s tapering decision, Fed’s new chairman decision, Syria military action, geo-political uncertainty, debt-ceiling debate, sluggish housing market, & rising interest rates.

Please note that IPM Model bottom date was August 30, and the market bottomed on August 30 @ 1628 and rose to 1730 on Sept 18 i.e. ~100 point rise in less than 3 weeks.

This is how market deceives the majority. Market is very clever!!


Tuesday, October 1, 2013

Government Shutdown (as Predicted) and Plan of Action

Two weeks ago, right after Fed's unexpected decision to hold-off on tapering, following was written at the blog:

"I think Federal Reserves' was looking ahead and they saw a real policy of a government shutdown in October, along with another long-drawn battle on debt-limit increase. That is why, they preemptive these political uncertainties by giving another doze of steroids to the market so that the impact of political stalemate does not ripple through the stock market, and consequently does not derail the nascent economic recovery.

As far as the political stalemate is concerned, this time it will be bad! On all previous occasions politicians started working on the debt-ceiling / government shutdown issues at least ~2 months in advance, with media shouting about this possibility ~3 months in advance. For example, in 2011 debt-ceiling was being discussed in the media in April/May time frame, months before the actual stock market decline in August.

But this time, it is different. Today, was the first time I saw something on the news about a potential government shut-down in a financial news outlet. This means that lawmakers are not taking this shut-down seriously with only 2 weeks left to the the shutdown. This will be followed by debt-ceiling debate, which needs to be settled in less than a month. And finally, since Republican lawmakers have been burnt by sequestration earlier this year, it is highly unlikely they will easily cooperate on this issue."

It came true tonight! But the above analysis does not say how the market should or will react. In fact, as per IPM model we defined the market trajectory in August 25 and Sept 8, 2013 updates. Market has been following the script very precisely. 

So the question is what will happen next? There is a very high potential that market will rally into the next IPM model top date. In other words, it will rise in the face of political uncertainty, because this will be the least obvious trade. However, this rise will be capped by the IPM Model top date.

IPM Model update with detailed market analysis will be sent out to subscribers today! 

Friday, September 20, 2013

Fed Decision & Gov't Shutdown: This Time Its Real (Part 2)

Part 1

This question suggests that either Fed does not think the economy is strong enough right now, which means there is some thing fundamentally wrong. Or they are anticipating a major shock in the near future. This leads us towards the upcoming budget discussion and possible government shut-down starting on October 1, 2013.

I think Federal Reserves' was looking ahead and they saw a real policy of a government shutdown in October, along with another long-drawn battle on debt-limit increase. That is why, they preemptive these political uncertainties by giving another doze of steroids to the market so that the impact of political stalemate does not ripple through the stock market, and consequently does not derail the nascent economic recovery.

As far as the political stalemate is concerned, this time it will be bad! On all previous occasions politicians started working on the debt-ceiling / government shutdown issues at least ~2 months in advance, with media shouting about this possibility ~3 months in advance. For example, in 2011 debt-ceiling was being discussed in the media in April/May time frame, months before the actual stock market decline in August.

But this time, it is different. Today, was the first time I saw something on the news about a potential government shut-down in a financial news outlet. This means that lawmakers are not taking this shut-down seriously with only 2 weeks left to the the shutdown. This will be followed by debt-ceiling debate, which needs to be settled in less than a month. And finally, since Republican lawmakers have been burnt by sequestration earlier this year, it is highly unlikely they will easily cooperate on this issue.

All of the above mentioned scenarios combined, suggest that there a lot of headwinds for the market in the near future. Under these circumstances, we will analyze the IPM model for trade timing  

Thursday, September 19, 2013

Fed Decision & Gov't Shutdown: Logic Behind Fed's Decision (Part 1)

So everyone was surprised by what Fed did yesterday. In fact, it is one of the times after a long time that I have seen so many people caught off-guard. Since I was expecting the market to go up after the announcement of the taper, I was not surprised by the rally after the announcement. I was surprised by the announcement to not taper. And to be sure, this surprise was equally shared between financial news media and economists. Since the surprise decision is now out, the question remains about the context of this decision.

In real world economists, Federal Reserve's officials, treasury analysts and central bankers typically make policy decisions based on fundamental analysis of macro-economic indicators. These indicators tell them how to manage their policy to control inflation, foster job growth and spur economic activity. Therefore, it will be very insightful to analyze the implication of federal reserve's recent decision of "not to taper" from a fundamental & socio-economic perspective.

For one, since everyone was expecting a taper decision. "Not Taper" turned out to be a perfect contrarion trade.

On the other hand, from a fundamental perspective the consensus was that Fed will start tapering its bond buying program in September 2013. And the reason behind this assumption was the language used by Fed's officials over the recent meetings was getting Hawkish. In these meeting's Fed's officials had started becoming "Hawkish" about the fiscal policy i.e. they were getting concerned about the potential increase in the inflation rate due to extremely accommodating monetary policy.

Behind the shift in Fed's language towards stricter monetary policy was recent economic data which was hinting towards robust economic growth in the US economy, along with significant gains in the housing market and stock indices. However, this data was available to the general public all over the world, and the data did not get worse over the last month or so.

Therefore, the question is: "What did the Federal Reserves' see differently during the September's FOMC meeting, which forced them to keep the extraordinarily accommodative monetary policy intact?"

This article will continue in next part ...

Quick Market Update


  1. Emerging Markets have re-entered Bull Market
  2. Global Stock markets continue to be in Bull Market since December 2012.
  3. Will be buying on a dip, based on Trade strategy.
  4. Next significant top (at least for 2 week decline) will occur near next IPM top window (subscribers know the date)
  5. Weekly IPM model has been analyzed, and new date has been received
  6. Based on recent rally and re-emergence of emerging market Bull, it is likely that a Major Top will take place near Weekly IPM Model turn date.


Near term, market is over-bought, over-crowded  and over-optimistic. It will go through some consolidation over the next few days!

Details will be published later

Sunday, September 15, 2013

Fed's Taper & Market Reaction

Federal Reserves will make a decision about its monetary taper in this upcoming week. Majority of analysts are expecting a taper. The question one should be asking right now is that how will the markets react to Fed's decision to taper. This is because only market's price reaction to the news pays, and not what the news was. As for the market, it has been rising nicely for the past 2 weeks. In fact, after bottoming on August 30 (the IPM Model bottom date), market has rallied to 1690 in 2 weeks i.e. an increase of ~70 points.

As we approach this critical week, markets are over-bought and some sentiment measures are touching optimistic extremes. This type of market behaviors asks us to be cautious over the next week or so.

If we had a Federal Reserves meeting scheduled with possibility of taper at a time when sentiment was pessimistic and market had been over-sold, it would have been a good time to buy the FOMC meeting's outcome. However, current market structure from an Elliott Wave perspective along with Market Matrix's analysis suggests that we might be in for a sideways to down market over the next few days.

From a global perspective, emerging markets are in a very interesting position. These markets have been in a downtrend since January 2013. Although they have seen a sharp rally over the past few weeks, this rally has brought the emerging market index at a critical resistance level.  If EEM fails to break sharply above recent highs, there is a serious potential that downtrend will resume.

Please note that according to proprietary market classification methodology, emerging markets recently entered a bear market in May 2013, and have been in a bear since then. Now the question remains if they will be able to break into a bull market, or the Bear will re-assert itself. Bear's reassertion would lead to widespread consequences. Next week will give us a better picture of how the emerging markets will react to Federal Reserve's monetary policy decision.

Finally, futures are rallying sharply on the decision of Larry Summers withdrawal as Fed's next chairman. This rally has taken most of U.S. indices to all time highs. It falls nicely in line with September Strategy


Friday, September 13, 2013

Market Analysis & Action Plan

Initial Target has been met for the long trade.

Following reasons for concerns are now appearing in the market:


  1. TRIN reading is at a point which has coincided with previous rally pauses. TRIN is suggesting an over-extended market
  2.  NYMO gave a sell signal few days ago. So it is something to look at with all other indicators piling up.
  3. NYAD and TICK: Both are not suggesting that recent rally has been broad based. Therefore, one should be on the lookout for potential downside.
  4. Money Flow Index: Has not registered an overbought reading, which means the potential for a rally continuation are bleak. Money flow index overbought reading typically suggests rally continuation.
  5. Sentiment is getting very frothy, especially from a put/call ratio perspective
  6. Elliott Wave analysis suggests that DJIA and SP500 are carving out 2nd waves, with final rally approaching soon.
  7. Global Dow has approached overbought levels. These levels have previously corresponded with near term declines.
  8. We are approaching a minor IPM turn window (subscribers: please consult IPM model update).

Keeping all of the above in mind, following action plan makes sense:
  1. Exit (1/2) around 1690
  2. Exit all in the near future to protect against Fed's decision and market's knee jerk reaction
  3. Re-enter during next IPM model turn window
  4. Exit by earnings
  5. Overall, market is setting up for a lower high at the next Major IPM model turn window (please consult IPM Model update sent on September 5, 2013). This trajectory is highlighted in the IPM Model library


Tuesday, September 10, 2013

Predicted vs Actual - IPM Model Updates

Following chart highlights the IPM Model turn dates and the corresponding market action, in regards with DJIA. Won't it be great to go short at the top, and hold on to short through the exact bottom date, where you can go long again! 


September 2013 Trade Strategy

IPM Model Top Prediction on August 5, 2013


IPM Model Update: Latest IPM Model update was emailed to subscribers on 9/8/2013. Data is still fresh. So if interested, subscriber below:


Sunday, September 8, 2013

IPM Model Update

Latest IPM Model update has been emailed to SUBSCRIBERS

Excerpt from IPM Model Update
In the last update on August 25, it was stated that “market could experience one more decline over the next week before bottoming out to rally for a few weeks. As the market rally unfolds, we will keep an eye on internal strength indicators to evaluate future of the market i.e. new highs or lower high.” Market was at 1668 on August 26 and then declined to 1627 on August 30, which has been the low.  


Now, it is time to evaluate the current rally and its future prospects especially when Syria War, Fed meeting, and new Fed chairman decisions are on the table. Next few days will be very interesting, as they will set the tone for September.   

Wednesday, September 4, 2013

September 2013 Trade Strategy

September 2013 Trade Strategy

This strategy is based on IPM Model turn date, TPAP model and current market matrix analysis

Monday, September 2, 2013

Market Trajectory & Trade

There are two possible trajectories for the market from IPM Model Turn Window (closest) to IPM Turn Window (next)

1- Bottom ==> Top (sharp rally)

Indicators: Weaker internal negative strength on the decline. No new low after IPM turn window expires.
Suggested Market Behavior: Strong rally after bottoming during IPM Turn window
Trigger: Rise above xxxx
Timing: Market will show its cards during 2nd half of the closest IPM turn window

This scenario could result in multi-week rally from the IPM model turn window


2- Bottom ==> Lower Low ==> Top (sideways to rally)

Indicators: Strong internal negative breadth on the decline. New low after IPM turn window expires.
Suggested Market Behavior: Continued decline immediately after IPM Turn window expiration
Trigger: Rise above xxxx
Timing: Market will show its cards during 2nd half of the closest IPM turn window, which will enable us to asses the negative breadth of the market.

This scenario could result in multi-week sideways action before topping out at the next IPM model turn window

Summary:
Scenario 1 has a higher probability based on Market Matrix analysis. However, we need to wait for a market trigger and keep stop losses in place to minimize losses.


Saturday, August 31, 2013

Downtrend Confirmed by 8/4 Test

Market just experienced the worst month since May 2012, but sentiment did not reach extreme. Although we did receive some buy signals, panic selling was not recorded. In absence of panic selling, it is hard to say that decline has ended.

At the same time, 8/4 Test (on daily time frame) to the Downside has been completed in multiple markets, including:

  • DJIA
  • SP500
  • Russell 2000 (very close)
  • Global Market Index

This suggests that the trend is now down. Although we are still in a bull market, we should be careful about some acceleration to the downside.

Overall, it is clear that multiple market indicators: 8/4 Test, Sentiment, Elliott Wave, Trend and Supporting Market, are now aligning to indicate that further market decline is in front of us.

Please note that IPM Model turn date has been emailed to subscribers. This update will also include potential trade strategies over the next few weeks.

Note: Understand, Survive and Thrive started predicting about an approaching downtrend since May top because May top coincided with the "Weekly IPM Model" turn date. In the hindsight, that was the time when Real estate index, Emerging markets, Utilities and other front running supporting markets did top out. Therefore, IPM Model has some serious predictive powers by the grace of God

Tuesday, August 27, 2013

IPM Model Top Prediction on August 5, 2013

IPM Model predicted the latest stock market decline to the day i.e. Stock Market Top on August 5, 2013:

August 5, 2013 IPM Model Update

"Latest IPM model re-run suggests that we are within an IPM Model turn window, which is

scheduled for August 5, 2013 (+/- 4 days), and according to statistical calculations it should

mark a market Top. This means that recent slow grind higher is coming to an end, and we will

soon see a decline in the U.S. markets."


"All of the above analysis suggests that market could soon start a decline phase which could last

for few weeks."

Sunday, August 25, 2013

Fed's Dilemma: Stop QE, Continue or Increase!!

Recently we have hearing a lot about Federal Reserves tightening the monetary policy towards the end of this year. This assumption is based on clues coming out of the FOMC meetings. Latest news came out on Wednesday, when the Fed's minutes showed that FOMC committee members are much more "Hawkish". Let me first explain what do these words "Hawkish" and "Dovish" mean.

Hawkish: Favouring increasing interest rates; inclined towards increasing interest rates.
Dovish:  Disfavouring increasing interest rates; inclined towards not increasing interest rates.

Let's analyze Fed's mandate. Federal Reserves has a dual mandate:

1- Control inflation:
2- Maintain unemployment levels

Fed controls inflation by increasing or decreasing interest rates. Inflation is caused by free movement of money in the system. If there is more money, it will cause inflation. If the money supply is reduced, it will reduce inflation or even cause deflation.

Typically, when economy is growing it causes inflation because people have more money and they tend to buy more. This increase in buying power results in higher prices of stocks, real estate, commodities and other investment instruments, which in turn forces people on the sidelines to join the buying frenzy.

Under such circumstances, Federal Reserves uses interest rates to reduce inflation. They increase the interest rate to give an incentive for people and institution to save versus invest. Since investors can earn higher interest without taking any risk, they prefer to save. Saving money in banks results in lower monetary supply, resulting in lower number of buyers of stocks, commodities and real estate. This helps in cooling down inflation.

Lower demand forces companies to adjust their production. For example, if there is low demand of housing then construction companies will lay-off people. Housing industry will be followed by other industries, which will result in higher number of layoffs and an increase in the unemployment rate.

As a result of increased unemployment level fewer people will be able to buy, resulting in lower inflation. As inflation goes down and unemployment goes up, Federal Reserves again uses its interest rate tool to adjust these two areas. However, this time they reduce the interest rate. By reducing the interest rate, they reduce the incentive related to savings. This reduced incentive forces individuals and banks to again start investing in the investment areas, which again increases the monetary supply. And the cycle starts again.

This cycle allows FED to maintain the economy in the perfect state of equilibrium. However, right now Federal Reserves has a very strange dilemma at its hands. Interest rate maneuvering & QE has not improved overall unemployment situation. And now, interest rates have started to go up in anticipation of inflation caused by QE induced price increases, even without Federal Reserves increasing its rates. In other words, market is telling Federal Reserves that if you won't increase the rate, we will do so without you.

So Fed has two options now:

1- Keep the rates low, with the hope that people will keep on investing and inflation will not start rising. This option is bad because it will result in increased inflation, which will result in higher rates. Higher rates will choke-off ability of investors to invest in business activities. Thus, choking off economic recovery.

2- Increase the interest rate to kill inflation expectations. This reduction in inflation expectation might result in a decline in interest rate, in the next few years but it will bring back deflation fears. Higher rates from Federal Reserves, will reduce investment incentive at the bank-level. Again choking-off the economic recovery.

Under both scenarios, Federal Reserves' is playing a losing games. Logically, Fed will go with option 2. This will allow them to reduce inflation expectations, keep investments going a bit longer. Reduction in expectation will result in lower interest rates in the interim. However, in the long-run we will experience another bout of Deflation, and possibly another stock market crash.

This analysis flows well with the current bond market's technical picture and the housing industry's forecast. Both of these trends combined suggest that a very good time to buy houses/real estate is coming in the near future. 

Thursday, August 22, 2013

2009-2013: Real Estate and Housing Rally Analysis

In this post, we will be analyzing Real Estate and Housing sectors' rally from 2009 low. This analysis will help us better understand the nature of this rally, and its future directional implications.

The first chart shown below is of the Real Estate index. This chart clearly shows a 3-wave rally from 2009 low. 3-waves are corrective in nature. Therefore, the rally from 2009 to 2013 can be regarded as a market correction. Following chart also shows a major trend line from March 2009 lows. This trend line had so far contained the up-trend, but it has recently been breached to the downside. This also suggests that the up-trend in trouble.


Second chat, is also of the Real Estate index. In this chart one can see that Wave-Y ~= 0.61 x Wave-W. This is a classic wave Y relationship. Although it is not perfect, it is close enough. This is yet another reason to be careful about Real Estate stocks and the overall Real Estate market.


Finally, the third chart shows a 3-wave rise in the housing sector. This chart is of XHB (another housing ETF). The best aspect of this chart is that it has formed a very nice parallel channel since March 2009 bottom. Parallel channels, after a significant decline (2006-2009), typically symbolize bear flags. And are followed by resumption of the trend in the primary direction.


In summary, all of the above 3 charts suggest that the rally from March 2009 to May 2013 has been a corrective wave. And as long as Real Estate/Housing markets do not rally above May 2013 high, we should be on the look-out for another bear market in the housing industry. This would mean that housing prices will suffer further, which will in turn impact the overall economy. 

Tuesday, August 20, 2013

Real Estate Market - End of Recovery?

Yesterday House Builders Index was analyzed in terms of Elliott Wave count, to gain a better understanding of their future trajectory. Today, we will continue the housing analysis by analyzing the Real Estate index. Real Estate index is a very good barometer of the overall Real Estate market.

Real Estate market is a very broad category. It ranges from residential properties to commercial building, rental properties to investment complexes. Therefore, a decline in this index means that something is fundamentally wrong with the market. On the other hand, if this index keeps on rising, it means that underlying fundamentals behind Real Estate industry i.e. demand/supply metrics are nominal.

Like housing, real estate plays a pivotal role in the U.S. economic growth. If real estate and housing both are pointing back down, it will put significant pressure on the U.S. economy. This can be very bad for the overall economy, especially at a time when economy has not reached escape velocity and FED is considering tapering.

Following chart highlights the Real Estate index:


As evident from the above chart, real estate index went through a clear 5-wave decline (2006 to 2009). This decline suggested that the trend in the real estate market had turned from up to down. However, even in downtrends markets experience counter trend rallies. And that is what we have seen in the real estate market from 2009 to 2013.

This rally has taken on an overlapping shape, with market tracing out: A-B-C - X - A-B-C. Each A and C wave can be sub-divided into 5-sub waves. Due to this overlapping structure, and 3-wave market action, one can safely assume that rally in the real estate index from 2009 to 2013 was a corrective rally. Once this rally is complete, which it probably is, we will see a resumption in the downtrend.

When we evaluate Real Estate index rally in terms of Fibonacci levels, we realize that rally from 2009 to 2013 retraced 78.6% of the original decline from 2006 top. This is a classic wave-2 retracements. Such deep retracements not only bring back optimism, they also bring back new buyers into the market with the assumption that bottom is in place and we will go higher from here. Right at that time, wave-3 down starts which wipes out all the gains made during wave-2 and then some.


Therefore, based on the above Elliott Wave & Fibonacci analysis, it seems like the Real Estate market is close to a top. This observation is further supported by the Head and Shoulders formations appearing in the Housing and Real Estate indices. A top in Real Estate index might be the start of another recession in the U.S., and probably the world!

Note: Real Estate index topped on May 15, 2013. This was the same date when the Weekly IPM Model predicted a top!!! After few years, we might see back & realize that the recession started in the United States on May 15, 2013.


IPM Model UpdateIPM Model again predicted the market top on the exact date - August 5 (by the grace of God). Subscription