Twitter

Wednesday, October 26, 2016

2016 YTD Strategy Performance

2016 has been a very difficult year for money managers and investors alike. They had to withstand many shocks through the first half of the year, which resulted in elevated volatility environment.

Once the volatility subsided and the markets started rallying after the Brexit,  investors got all excited about prospects of the market. However, this joy was short-lived, as markets have not made any progress since mid-July. Sideways action of last 3+ months has been strenuous for market participants and financial media. Financial media has been coming up with new reasons for the market to move but every time market declines to show its hand in either direction (up or down). 

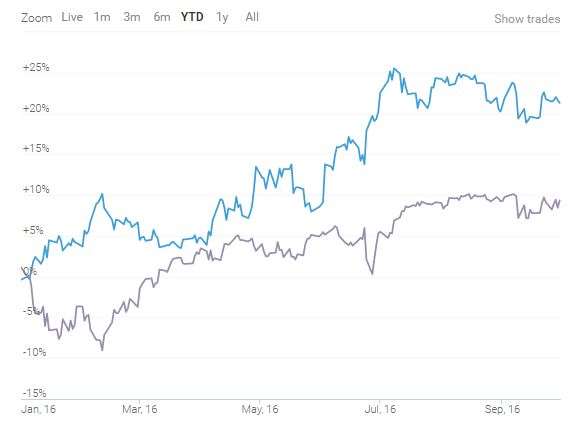
While markets were going sideways and had a very difficult year, our proprietary investment strategy has handsomely out-performed the market - by 14.3%.

SP500 Performance (Jan 1 - Oct 25) = 6.7%
Conservative Strategy (Jan 1 - Oct 25) = 21%

Cumulative performance since January in relation with SP500 (total returns) is shown below:

This out-performance is happening at a time when hedge fund, mutual fund and all other critical performance indices are poorly under-performing the market. 

Risk Management
Furthermore, the beauty of this portfolio is not only in its performance, its in the way it manages risk and generates Alpha. The portfolio, as of today, has a component weighted Beta of 0.37. In other words, it is almost totally uncorrelated with the market. Therefore, markets rise/decline will not impact the returns of this portfolio. This means that almost all the gains can be treated as Alpha, while Sharpe ratio is 1.7

Agility
Model is also agile enough to take advantage of trend changes and re-allocate prior to big market moves.

In short, this portfolio can help diversify your risk, amplify returns, protect gains and provide peace of mind, so that investors can focus on more important things like think about next big idea, theme or change.

If interested in free e-mail list or in paid services, please fill-out the form below.


Tuesday, October 25, 2016

Inflection Point Model - Performance Recap

Inflection Point Model predicted a market turn date on Oct 21, 2016. Market declined on the 21st and then rallied. The rally continued today and futures are up now. With new catalyst along the way in the form of earnings from Apple and Google, we can expect more gains. Good thing is that even with today's very powerful rally, there was no sell signal. This suggests that the trend remains intact and is strong.

IPM Output - Turn date 10/21/16
Following chart shows the IPM model's output, as shared on Oct 17th (link)
Market Structure
Analyzing IPM model in conjunction with the market structure showed us that the trend had been sideways to down since mid July. Hence, the likely scenario was for market to put in a bottom during the IPM turn window and rally.

Following chart shows the latest structure shared on the blog along with a blue box, highlighting potential market turn window.


Following chart shows performance of SP500 as of today i.e. after bottoming within IPM turn window on Oct 21, one can observe the green bar with a gap up. Today's performance shows that the market gaped-up but did not cover the gap, hence, hinting towards a strong move. At the same time, confusing so many market participants, who have been taking failure of rallies as the new norm. 


Next Steps
We will continue to evaluate the market with respect to its structure and Inflection Point Model. One of the biggest benefits of the IPM model is to forecast potential market turn dates. And when IPM turn dates are combined with Market Classification Modal, it paints a much clearer picture. 

Market Classification Model is bullish. Next run of the model will be in next few days. Once the model is processed, it will tell us whether the internal strength of the market justifies a continued bullish posture or should one be wary of market trend changes. This information will be shared with subscribers immediately, so that they may evaluate their long investment positions.

Tomorrow's market Action
So far the futures are up and we could see a  continuation of the rally. This rally has a lot going for it but there are some signs of tiredness appearing in the market. We will evaluate the market structure and next IPM turn window in upcoming posts.

If interested in free e-mail list or in paid services, please fill-out the form below.

Saturday, October 22, 2016

Sideways Gyration Continues...

For more than 3 months markets have been going sideways. This sideways action is not only boring, its very straining for investors, economists and everyone else. As market goes sideways, investments don't yield returns which frustrate investors and they try to do things that more often than not hurt them. It's a way of market to throw us off our investment strategy. But the goal is to be not be dissuaded by the market and keep following a plan.

Along side regular investors, it significantly impacts options traders. Sideways market action is disastrous for option premium. As a result, options expire worthless. SP500 is currently at the same level as it was in early July. So over last 3 months, market has not gone any where.


If anything, it has a slightly downward trajectory since August. On one hand, this kind of market action is positive for long-term market gains, as market is digesting gains and will most likely breakout, it begs the questions whether we have seen the bottom or market still needs to do some work on the downside.

We are blessed to be up ~20% (YTD), while SP500 is up ~6%. Detailed performance analysis will be shared at the end of the month.

Identifying Next Market Move
Identifying a top or bottom remains a very difficult job. In order to correctly project market's next move, we need to take into account 4 items:
  1. Timing
  2. Structure
  3. Market Signal
  4. Confirmation
Without all of the above items lining-up, its premature to assume that trend has reversed.

Timing
In regards with market timing, we are currently within the Inflection Point Model's turn window. Window is shown above in blue box and is shown below:
Turn window will expire at the end of next week.

Structure
Market structure remains corrective but there is a potential that we can see a decline before sustainable rally. Therefore, if the market rallies and can sustain the rally, it will be signal of bottom. If the market cannot sustain the rally and starts declining in the next couple of days, it will suggest more work is needed on downside. 

Market Signal
If market performance over the next few days generates a technical signal, it will show us whether market will top or bottom within this turn window

Confirmation
Once the trend is set, we would need a confirmation by proprietary levels to confirm the move.

Conclusion
Market remains in a sideways pattern. This pattern will soon end but will confuse many market participants along the way. At UST, we know that the market is within a turn window, now we just need to wait for a market signal and confirmation to confirm the next move. 

Overall, market remains in an uptrend. And in the next post we will see the value of adhering to Market Classification Model. We will also be writing a series of posts on how our proprietary strategy fared in a confusing sideways market. This will be an amazing case study and I am thankful for the fact that we have seen this kind of market action because it will enable us to see the benefits of certain key aspects of our strategies.

If interested in free e-mail list or in paid services like Market Classification Model, IPM or others, please fill-out the form below.

Friday, October 21, 2016

Stock Market Consolidation & Break-out Levels

Since July, market has been going sideways to down. This downdraft has been persistent, boring and choppy. While markets are still within 1-2% of all-time highs, this choppy action has brought forward a lot of bears and helped improve the valuation measures like P/E ratios. 

In fact, the true purpose of these kind of market declines/sideways corrections is to reduce optimism and lay the foundation for the next rally phase because investors get tired of the market performance.

Sentiment - Fear/Greed Indicator
CNN's fear greed indicator is suggesting that the frothy sentiment that we saw in mid July has now been replaced by lack of enthusiasm towards the market. 


In fact, the sentiment is as negative right now, as it was at the time of Brexit. Therefore, we can see another sharper rally from these levels.


Signs of a Break-out
While market's decline has been choppy in nature, it is along the top downtrend trend line. One key indication of a market trend reversal would be a break of the trend line to the upside. For DJIA, this trend line is currently at 18,300.  


A similar situation is present in case of SP500, where the downtrend line is crossing at 2166.


Therefore, a sustained rally of 100 points in DJIA and ~20 points in SP500 would confirm a break-out.

Overall, the markets remain in an uptrend. Market Classification Model remains in an uptrend. Therefore, there is a very high probability that we will soon experience a market break-out. Long lasting sideways action is preparing for a break-out after resetting optimistic sentiment, market valuations and technical indicators

If interested in free e-mail list or in paid services like Market Classification Model, IPM or others, please fill-out the form below.

Wednesday, October 19, 2016

The Next Big Opportunity - Emerging Markets

US Markets rallied impressively today. More importantly, they maintained the gains that were achieved at the start of the session. Hallmark of a sustained rally is that it continues and does not fail.

While US stocks are coming out of a consolidation phase (detailed analysis), and have many catalysts that could propel them to higher levels, the next big move might come from the emerging markets.

Long-term Emerging Market structure
Emerging markets have been in a sideways mode since 2011. For the past 5 years, emerging market have consolidated while US markets were making new highs. Following chart shows the performance of EEM (emerging markets ETF) over last 13 years.


Since 2003, emerging markets have gone through 4 phases:

  1. Major rally (impulsive move) lasting for several years and culminating in 2007
  2. Major correction of 2008, which was caused by global financial crisis
  3. Sharp rally out of the financial crisis lows of 2009
  4. Correction from 2011 highs that has brought EEM down to levels not seen 2006
Interestingly, both corrections (2 and 4) have a corrective formation i.e. 3-wave structure and both rallies (1 and 3) are impulsive in nature Therefore, it means that the trend remains up. And if the recent correction has ended, we should expect a very sharp and long-lasting rally in the emerging markets.

Short-term Structure
From a shorter term perspective, emerging markets are consolidating in a sideways formation. Once this sideways action ends and the market breaks out to the upside, it will have a lot of momentum. In fact, it could lead emerging markets to reach 2011 highs in the next burst higher.


Emerging market components
Although the EEM components will be adjusted next month, currently Chinese stocks determine the performance of the emerging market ETF. If Chinese markets are break-out, the entire emerging market complex will follow suite.

Market Classification Model
We have developed MCM for emerging markets. We will share the latest finding with subscribers. However, the bottom line is that the trend is approaching a reversal in the emerging markets to the upside. Once the trend reverses, we should expect a long-lasting rally in the emerging markets index.

Persistent investment behavior is critical for longer-term capital gains because that's the best way of gaining preferred tax treatment, which can significantly help your portfolio.

If interested in free e-mail list or in paid services, please fill-out the form below.


Monday, October 17, 2016

Market Timing (IPM Model) & Structure

Just re-ran the Inflection Point Model and it seems like the next turn window is approaching fast. It is scheduled for October 21, 2016 (shown in chart below)
As you can see from the above chart, last turn window was on Sept 26, 2016. And the market topped on Sept 22, 2016, followed by ~3 weeks of sideways action. Following chart shows the best market structure representation with latest timing information


Market is still in a sideways correction. In fact, the 2nd portion of this correction took the shape of a triangle (X). Now it is in the final leg of this decline. So far, this last leg of the decline has been tracing out 3 waves, which means that this might turn into an ending diagonal.

Last wave will be sub-divided into 5 parts. 2 of 5 have been completed. The market could bottom in the area of 2090-2065 (SP500).

A signal of bottom will be generated by a buy signal generated within the IPM turn window. Confirmation will be received by a rally above critical proprietary levels.

Overall market trend remains up and this correction should give way to a sharper rally. Seems like market is setting-up for a wash-out to scare enough people out of the market, so that a big year end rally can start.

If your already long, stay long. If you want to go long, wait for another few days and then start adding longs.

Market Classification Model
Market Classification Model (MCM) remains bullish on the US stock market. It turned bullish in July 2016 and has remained bullish through last 3 months. Even though many market pundits have been advocating a sharp decline.

Persistent investment behavior is critical for longer-term capital gains because that's the best way of gaining preferred tax treatment, which can significantly help your portfolio.

If interested in free e-mail list or in paid services, please fill-out the form below.

Friday, October 14, 2016

Stock Market Bottom & Next Rally

Market's correction appears to be complete. It was a long drawn out process. After topping in early August, market went sideways with certain phases of sharp declines.

Market Correction
Recent market action has been one of the most choppy phases over last 6 years. Interesting, this choppy behavior did not result in a triangle. As you can see below, latest decline that ended yesterday, made a lower low below 2120 level. As a result, we can mark it a zig-zag correction.


Many market participants were expecting a break of  2120 to mark the start of selling. However, at this point it could turn out to be a bear trap, where market participants are caught off-guard with the rally. Furthermore, since recent correction was not a triangle, it can be regarded as a 2nd wave decline.

Approaching Rally
Investors who follow Elliott Wave theory know that after 2nd wave comes one of the strongest parts of the rally, knows as wave 3. Following chart shows that the market might be setting-up for a sharper rally in wave 3, which will easily take the market to all time highs and will take Nasdaq into the Vacuum zone, where it might get sucked up (details).


This rally phase will be continuation of the rally that started after Brexit vote!


Rally Support

Consolidation
Every rally needs fuel and if you look back at SP500 chart over last 2 years, latest decline brought SP500 back in the area where it was in Jan/Feb 2015 (shown below).


In other words, market has gone sideways for almost 2 years. This kind of consolidation suggests that there is a lot of energy available in the market if it wants to rally hard. Now that the earnings season is upon us, there will be enough catalysts to propel the market out of current range.

Buy Signal
Yesterday, market also generated a buy signal. This signal is another reason to be on the look out for a sharp rally.

Market Classification Model
Market Classification Model (MCM) is a long-term trend identification model. It went long at the end of June and since then it is bullish. Before that it went out of the market in Sept'15 and kept us away from the volatility during China/Oil scare of Jan/Feb'16 decline, then interest rate scare of Apr/May'16 and during Brexit volatility in June'16. All the while allowing us to be invested in assets that were yielding much higher returns.

However, since turning bullish at the end of June'16, it has remained bullish even during the recent decline when all of the financial media outlets started talking about a new bear market or severe correction. MCM allows us to stay on the right side of the market and add to long positions in case of corrections in bull-market. Otherwise, one might be scared to go long in a sideways market, not knowing whether it will turn into a bear market


If interested in free e-mail list or in paid services, please fill-out the form below.

Tuesday, October 11, 2016

Stock Market's Next Big Move

Overall the market remains in bull market. Today's decline was a small part and would need to persist for few weeks before the underlying internals switch. As of now, the internals are in very good shape.

Bull Case:
Today's decline can be read as the last decline as part of the recent ~3 month long correction. We have also seen a lot of bearish articles being published in the financial media, which suggests that the trend is probably near exhaustion.


With earnings right around the corner, market might have completed a complex correction pattern over last few months. This correction was soon complicated and choppy that it pushed out many market participants.

The head and shoulders pattern in all the indices remains active (shown below)


Once the market breaks above 2170, it will signal the start of a new rally phase

Bear Case:
If the market is truly in for a bigger decline, it won't be able to rally above 2160. Instead, it will decline after a minor rally. This decline could last for couple of weeks and could be supported by the earnings reports.


Market Classification Model:
MCM remains bullish and our proprietary portfolio remains long Stocks along with other investments. So unlike financial media, we don't foresee major correction in the near future.
.

If interested in free e-mail list or in paid services, please fill-out the form below.

Monday, October 10, 2016

Structural Analysis of Gold

Gold has been declining for the past 2 months. Gold spiked after Brexit vote but since then it has gone sideways.


Above chart shows that the Gold bottomed at the end of 2015 and then rallied for more than 6 months. After topping in early July, Gold went sideways for 3 months before undergoing a sharp decline at the beginning of October'16.

However, interestingly, latest decline has just completed a 3-wave corrective structure in Gold. 3-wave corrections represent that the primary trend remains intact and we are just experiencing a minor pull-back in the asset.

A similar pattern is visible in Silver. But Silver is sporting a much more clearer structure. Recent correction was clear 3-waves with a triangle in the middle. 


Furthermore, Silver is sporting a series of 1s and 2s which means that a big rally is coming in the Silver market. And when Silver starts to rally hard, it is a good time for Gold to follow.

Now that the Gold and Silver are showing that they are undergoing correction in broader uptrend, let's look at the Gold stocks. Gold stocks have rallied amazingly since the beginning of this year. Almost 200% rally from January bottom in GDX. Recently, they have also undergone similar correction over the past few months.

Following chart shows the performance of gold stocks:


Gold stocks clearly show a 3-wave decline, which means that this is just a correction and primary trend will resume soon.

Overall, the trend remains up in precious metals as shown by the market structure analysis. Market Classification Model also remains in a bull market for Gold. Therefore, we are very close to a bottom of this correction in Gold and will soon see a resurgence in the yellow metal.

If interested in free e-mail list or in paid services, please fill-out the form below.


Wednesday, October 5, 2016

September Performance Recap

September was a volatile month in the markets.

If you look at the SP500 chart, it has been going sideways and frustrating many market participants.


As we mentioned in the last post, pretty much all the major asset classes have experienced sideways action over past month.

2016 has been a volatile year so far with markets declining sharply in Jan and February, followed by a nice rally. During these volatile times, our proprietary strategy has out-performed the SP500 by 16.3%.

SP500 Performance (Jan - Sept) = 7.8%
Conservative Strategy (Jan - Sept) = 24.1%

Cumulative performance since January in relation with SP500 (total returns) is shown below:


Monthly Performance: 

Following chart shows monthly variation in performance.


Model is agile enough to take advantage of trend changes and re-allocate in strategic positions prior to big market moves.

All of these returns are for a portfolio whose current Beta is 0.32 and whose YTD Beta is -0.57, which means that these returns are totally uncorrelated with the market. Therefore, portfolio has a very high Alpha.

If interested in free e-mail list or in paid services, please fill-out the form below.


Sunday, October 2, 2016

September 2016 - Market Recap

September was a volatile month for all asset classes, as it started with a sharp decline in Stocks, Bonds and Gold. We will discuss these assets below and will leverage this information for October forecasts.

However, need to highlight that last IPM turn window was scheduled for September 26th. Market has made a bottom on September 26th and it's possible that we will see a sharp rally in the next few weeks. We will share details on the IPM turn window in next couple of posts. We are already positioned in our aggressive IPM based strategy to take advantage of this date.

Bonds

  • Since the start of September, Bonds experienced severe decline
  • Decline brought out the bears, as expectations of an impending FED rate hike increased
  • The decline was so severe that at one point, TLT has decline -4.4% by mid month
  • This decline was followed by a sharp rally to near break-even levels for the month
  • In summary: A lot of volatility but no real action / direction, which is apparent from following chart

Stocks

  • Stocks opened September slow but soon after the long weekend and on the heels of a strong jobs report took a nose dive

Gold

  • In contrast to Stocks and Bonds, Gold started with a sharp rally. However that rally fizzled out
  • Since then, Gold has been going sideways. There are two options for the Gold in the month of October:
    1. Gold and precious metal complex has already bottomed and will soon rally to new highs
    2. Gold has traced out a triangle and will decline in October, to mark a bottom
  • Both of the above scenarios suggest that the metal will be higher in future months. The question is whether it will take a detour to lower prices before rallying


Summary

  • Consolidation is the name of the game
  • Overall SP500 gained +0.02 %, Bond lost -1.7% and Gold gained 0.7%
  • We will soon see a well-defined trend but volatility might continue till Presidential elections in November.

Upcoming Blog posts:

  1. Strategy Performance - September recap
  2. Forecasts for October
    • Stocks - Elliott Wave and IPM Model
    • Bonds - Structure and relationship with stocks
    • Gold - Long-term targets and patterns
  3. Performance of Options strategy based on IPM Model

If interested in free e-mail list or in paid services, please fill-out the form below.