Twitter

Showing posts with label gold stocks. Show all posts

Tuesday, April 4, 2017

Gold Rally Can Pause!

We started investing in Gold in 2016 April, after 4 years of being out of the Gold market. We again increased Gold exposure at the start of 2017, in our proprietary strategies (Jan / Feb
2017 Investment Strategies' Performance)Overall, Gold remains in an uptrend but recent development has made us wary of immediate upside of Gold. 

In this post, we have analyzed Gold's short-term prospects using multiple analysis techniques to showcase the rationale behind our caution:

Technical
After experiences a sharp decline in early March, Gold has rebounded nicely. It is now testing significant trend-lines (show below). These trend lines could act as resistance in the near-term and force Gold to consolidate.


Sentiment
While Gold could experience a pause, it will be a very constructive development. But what is not constructive is the fact that news media has recently turned bullish on the yellow metal. Following are some of the recent bullish Gold headlines:


Furthermore, other sentiment indicators also suggest that Gold and Silver are in for some turbulence. Following chart shows Silver positioning among large and small traders. Current positioning is at levels that have resulted in Silver going down or sideways.
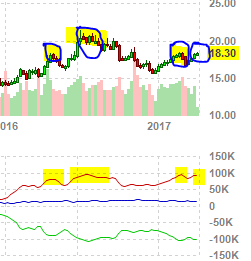
One cannot believe the financial news media because they get behind a trend, once everyone is on board. A detailed analysis of 2016 news and market action is presented here. Therefore, investors need to remain objective in terms of their direction and action plan.
Short-term structure:

With sentiment picture on the optimistic side, its likely that the trend will experience some pause before really asserting itself in the next few days. Above chart shows a potential inverted head and shoulders pattern being formed in Gold. However, the right shoulders doesn't look complete. Some back and forth action will be ideal to complete this structure.  

Gold Influence
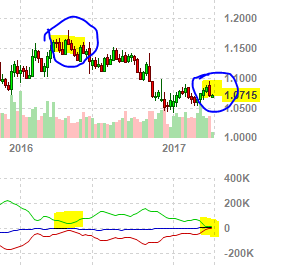
Gold is significantly influenced by USD and Euro. Strong dollar pressures the commodities complex. It looks like Dollar has completed a long-term correction since the start of 2017, and could rally for few weeks. Start of 2017 is the same time when Gold start rallying. Once US Dollar rallies, it would be negative for Gold and Silver markets.
Furthermore, Euro long positions are also very extreme, which means that Euro will soon experience correction. Euro decline will also fuel Dollar rise; another reason that could dampen Gold’s ascent.
Conclusion
Gold could experience some resistance around these levels because of technical, sentiment and influence from other areas. However, that doesn’t mean that Gold will not spring back or it has entered a down trend. In financial analysis, one needs to remain objective.

How are we positioning?
We have reduced our long exposure but maintain long positions because Gold remains in an uptrend, as per proprietary Market Classification Model. Details will be shared with subscribers by April 9th. Our conservative proprietary strategy has out-performed the market in 2016 and in Q1-2017 through objective risk-management and a combination of strategic & tactical allocation. Detailed performance analysis will be shared in next 2 weeks.

Want to Invest
You can invest in these strategies through “Managed Account” offering or by subscribing to some of the services like Market classification Model (subscription page). MCM serves as the backbone for our model and can help you develop an understanding of the markets.  If interested in investing, you can register below and we will send an update. 
 

Sunday, November 27, 2016

Gold Market Sentiment & Structure Confluence

In the last post we suggested that the trend in the Gold market is about to exhaust itself based on structural analysis (link). Since then the gold declined for a day and helped solidify the pattern, along with pessimism, necessary for a sustainable bounce.


Gold Sentiment
Gold sentiment has dipped to levels last seen near last year's lows. Following snap shots are from Daily Sentiment Index values on Nov 21.


Following chart shows longer-term DSI values (originally published by Taylor Dart). We can see that DSI is at lowest levels seen in last year.
Gold miners are also extremely oversold. They are at levels where we have seen major bounces in the past. This bounce can turn into major rally, dependent on internal market strength.

Hulbert index also shows that the sentiment is now negative 18%, which means that the average newsletter writer is now recommending shorting gold. Even though it is not at the lowest level, we have seen higher lows in the sentiment at the bottom. So it's possible that gold prices might bottom with a little elevated sentiment.


Market Classification Model
Along with all the positive developments on the sentiment front, the Market Classification Model remains in a bull market for Gold. As a result, we should not only expect a bounce but a resumption of the uptrend. This resumption could lead to acceleration to the upside. If the market completes the inverted head and shoulders pattern, we could easily see 1800 in 2017.

In the next blog post, we will discuss Fundamental reasons that could support this rise in Gold prices including asset rotation and Indian decision to restrict currency.

If interested in free e-mail list or in paid services, please fill-out the form below.


Tuesday, November 22, 2016

Gold Market - Approaching a Turn

Gold market has been declining for the past few months. This decline came after a very sharp start of the year rally in Gold. Based on gold market's fundamental, technical and sentiment analysis, Gold is approaching a bottom. From a technical perspective, there are three distinct reasons that point us towards an approaching Gold market bottom:

  1. Intermediate term Gold structure
  2. Longer-term goal structure
  3. Market Classification Model
Intermediate term Gold structure
Gold prices topped in early July. The peak in Gold prices coincided with Brexit panic. Since topping in July, prices have gone down in a choppy manner - characteristic of a market correction.

Even though Gold prices spiked on US election night, they went down and have declined since then. If we look at a slightly longer-term pattern, it seems like that the recent decline is part of a big corrective pattern that started in May. 


As a result, this correction will be wave 2 of the rally that started in Dec 2015. Once this wave ends, we will be in for a very sharp rally in wave 3. This rally will most likelt take the prices to near the all time high. Another evidence in this regard is the inverted head and shoulders pattern being carved out by the precious metal:

Inverted Head and Shoulders
Following chart shows weekly Gold prices over last few years. Once can see a nicely formed inverted head and shoulders forming. Once this pattern is completed, it's target is around 1800 level.


Other reasons to support the fact that Gold is approaching a major bottom is the pervasively negative sentiment as evident from Daily sentiment Index, Bullish Percentage Index or Hulbert Gold Newsletter Index.

Market Classification Model
Our proprietary Market Classification Model remains in a bull market. MCM utilizes prop trend identification algorithm to decipher between bull and bear markets. Currently it is in a Bull market. It entered a Bull in April and has maintained its posture since then. We use MCM to make investment decision and add positions.

In the next blog post, we will review sentiment analysis for Gold and fundamental reasoning for a gold rally.


If interested in free e-mail list or in paid services, please fill-out the form below.


Wednesday, August 24, 2016

Gold Movement

Gold experienced a sharp decline today, while Gold Stocks were massacred with a 7% decline in one day. This kind of price action was very important to remove the excessive optimism that had plagued the Gold market.

Since early July, Gold has been consolidating sideways. Following chart shows a potential pattern being traced out by Gold.


Gold price action appears to be corrective in nature i.e. first decline was followed by a triangle formation. Triangle has recently broken to the downside. Minimum target of this pattern will be a decline below 1310. We think that over the next few days, gold will bottom around ~1300 and then it can resume its trend. This level signifinies Fibonacci ratios and support line.

This decline will also bring back the bears and force many weak longs to get out of the market, just before the next rally phase, according to Market Classification Model.


A proprietary algorithm that classifies market conditions i.e. Bull market or Bear market. Currently, this model is suggesting a longer-term up-trend for the US Stock Market. For Subscription click below: