Twitter

Showing posts with label trading. Show all posts

Wednesday, November 2, 2016

Market Trend Remains Up

Sideways consolidation continued over the last week. The blog wasn't updated because of registration paperwork. We will discuss Investment Advisory registration in one of the upcoming posts.

Markets' sideways action remains intact. Even though in the last couple of days SP500 and US indices saw a relatively sharp decline, it did not impact the overall shape and form of the market.

Market Structure
SP500 is tracing out a diagonal pattern (shown below). One of the criteria of this pattern was to decline below C level, which it did yesterday. Now, the market needs to hold above yesterday's bottom to confirm that this pattern has been completed.


The overall market structure remains very choppy. This choppy action now spans over 4 months, which is a good enough time to correct the market through time. At weekly level this sideways action looks nothing more than a bull flag or pennant formation. And both of these are bullish in nature.


In terms of next market move, there are couple of options and will be determined by how the market participants react to the next rally phase. In either case, the minimum rally requirements would be above July 2016 high or around that level (SP500 = 2190).

Sentiment
Recent decline has also improve sentiment measures to suggest that a more sustainable rally is possible.

Fear/Greed indicator is at levels where it typically signifies a market bottom.

Similar another indicator just generated a buy signal and could mean that the trend is about to turn to the upside.


Market Classification Model:
MCM for stocks continues to be in a bull market. Therefore, the trend remains up and we will soon see a sharp rally. Even with yesterday's sharp decline, our strategy performed well. While SP500 was down 0.72%, we were up 0.20%. Another proprietary model is suggesting a sharp rally in our strategic allocation portfolio. We will see. So far by the grace of almighty, our proprietary portfolio is up ~20% YTD (after 10 months), which SP500 is up ~6%.

 If interested in free e-mail list or in paid services, please fill-out the form below.


Monday, October 17, 2016

Market Timing (IPM Model) & Structure

Just re-ran the Inflection Point Model and it seems like the next turn window is approaching fast. It is scheduled for October 21, 2016 (shown in chart below)
As you can see from the above chart, last turn window was on Sept 26, 2016. And the market topped on Sept 22, 2016, followed by ~3 weeks of sideways action. Following chart shows the best market structure representation with latest timing information


Market is still in a sideways correction. In fact, the 2nd portion of this correction took the shape of a triangle (X). Now it is in the final leg of this decline. So far, this last leg of the decline has been tracing out 3 waves, which means that this might turn into an ending diagonal.

Last wave will be sub-divided into 5 parts. 2 of 5 have been completed. The market could bottom in the area of 2090-2065 (SP500).

A signal of bottom will be generated by a buy signal generated within the IPM turn window. Confirmation will be received by a rally above critical proprietary levels.

Overall market trend remains up and this correction should give way to a sharper rally. Seems like market is setting-up for a wash-out to scare enough people out of the market, so that a big year end rally can start.

If your already long, stay long. If you want to go long, wait for another few days and then start adding longs.

Market Classification Model
Market Classification Model (MCM) remains bullish on the US stock market. It turned bullish in July 2016 and has remained bullish through last 3 months. Even though many market pundits have been advocating a sharp decline.

Persistent investment behavior is critical for longer-term capital gains because that's the best way of gaining preferred tax treatment, which can significantly help your portfolio.

If interested in free e-mail list or in paid services, please fill-out the form below.

Wednesday, October 5, 2016

September Performance Recap

September was a volatile month in the markets.

If you look at the SP500 chart, it has been going sideways and frustrating many market participants.


As we mentioned in the last post, pretty much all the major asset classes have experienced sideways action over past month.

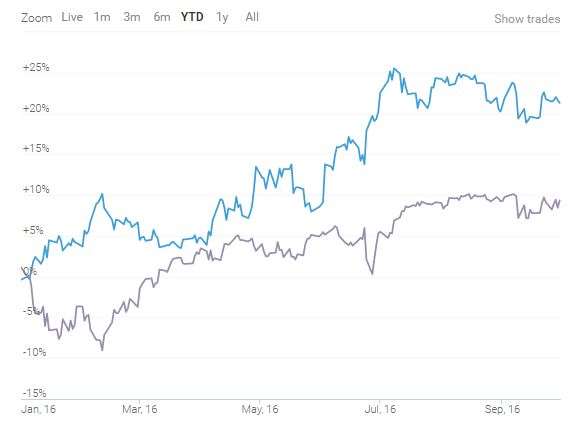
2016 has been a volatile year so far with markets declining sharply in Jan and February, followed by a nice rally. During these volatile times, our proprietary strategy has out-performed the SP500 by 16.3%.

SP500 Performance (Jan - Sept) = 7.8%
Conservative Strategy (Jan - Sept) = 24.1%

Cumulative performance since January in relation with SP500 (total returns) is shown below:


Monthly Performance: 

Following chart shows monthly variation in performance.


Model is agile enough to take advantage of trend changes and re-allocate in strategic positions prior to big market moves.

All of these returns are for a portfolio whose current Beta is 0.32 and whose YTD Beta is -0.57, which means that these returns are totally uncorrelated with the market. Therefore, portfolio has a very high Alpha.

If interested in free e-mail list or in paid services, please fill-out the form below.


Sunday, October 2, 2016

September 2016 - Market Recap

September was a volatile month for all asset classes, as it started with a sharp decline in Stocks, Bonds and Gold. We will discuss these assets below and will leverage this information for October forecasts.

However, need to highlight that last IPM turn window was scheduled for September 26th. Market has made a bottom on September 26th and it's possible that we will see a sharp rally in the next few weeks. We will share details on the IPM turn window in next couple of posts. We are already positioned in our aggressive IPM based strategy to take advantage of this date.

Bonds

  • Since the start of September, Bonds experienced severe decline
  • Decline brought out the bears, as expectations of an impending FED rate hike increased
  • The decline was so severe that at one point, TLT has decline -4.4% by mid month
  • This decline was followed by a sharp rally to near break-even levels for the month
  • In summary: A lot of volatility but no real action / direction, which is apparent from following chart

Stocks

  • Stocks opened September slow but soon after the long weekend and on the heels of a strong jobs report took a nose dive

Gold

  • In contrast to Stocks and Bonds, Gold started with a sharp rally. However that rally fizzled out
  • Since then, Gold has been going sideways. There are two options for the Gold in the month of October:
    1. Gold and precious metal complex has already bottomed and will soon rally to new highs
    2. Gold has traced out a triangle and will decline in October, to mark a bottom
  • Both of the above scenarios suggest that the metal will be higher in future months. The question is whether it will take a detour to lower prices before rallying


Summary

  • Consolidation is the name of the game
  • Overall SP500 gained +0.02 %, Bond lost -1.7% and Gold gained 0.7%
  • We will soon see a well-defined trend but volatility might continue till Presidential elections in November.

Upcoming Blog posts:

  1. Strategy Performance - September recap
  2. Forecasts for October
    • Stocks - Elliott Wave and IPM Model
    • Bonds - Structure and relationship with stocks
    • Gold - Long-term targets and patterns
  3. Performance of Options strategy based on IPM Model

If interested in free e-mail list or in paid services, please fill-out the form below.


Wednesday, February 19, 2014

IPM Trade Matrix Update - Trade 5 (Part 5)

Trade Overview
Today's market action was very constructive. While on one hand large caps like DJIA and SP500 absorbed recent gains by going sideways, small caps and tech stocks rallied sharply. This rally in small caps is a very encouraging sign for the broader market rally. Furthermore, breadth during this rally has been very impressive. 

Following chart shows a smoothed Advance/Decline line. According to this chart, market breadth hasn't been this strong in a while. 

Please note that this chart has two implications:
  1. We won't enter a new bear market right away i.e. current rally has a ways to go: 1929 comparison should not be taken seriously
  2. We might be approaching an overbought area and could see a pull-back over the next couple of weeks.
This chart also confirms IPM Trade Matrix's buy signal. The only difference is that the IPM Trade Matrix generated its signal several days before the breadth jump. Therefore, IPM Trade Matrix is a real-time actionable system with greater profit possibilities. 

Our Elliott Wave structural analysis of the market suggests that the market is in a firm uptrend. We are at least a week away from an intermediate term correction. Please note that this will not be a serious correction. It might just fill-out the right shoulder of the Inverted Head and Shoulder pattern (discussed earlier). IPM Top date has already been e-mailed to subscribers.


As evident from the above chart, market has just completed a sequence of 1s and 2s. As long as the stop levels are not broken (outlined below) we will stay long. If profit objectives for TNA are hit, we will bring our trailing stops closer per IPM Trade Matrix definitions and will let the market decide its next move.

Elliott Wave analysis cannot be completed without sentiment analysis. And current sentiment analysis suggests that we are still not seeing optimism in the market. This is  very good for the health of this rally. We will keep an eye on the stop levels and profit objectives, as we are approaching the end of Trade 5 per IPM Trade Matrix.


IPM Trade Matrix 2014 Trades

TRADE - 1: (Long) = +2.6%
TRADE - 2: (Short) = +9.3%
TRADE - 3: (Long) - Non IPM Trade Matrix trade -0.2%
TRADE - 4: (Short - 1/31/14 to 2/5/14) +7.25% 

TRADE - 5: Long
Long TNA at 70 ==> new TNA basis = 69.94 (added few longs today) 
Longs were initiated on 2/11/14 and 2/13/14 based on IPM Trade Matrix Trigger and Elliott Wave structure. More might be added if opportunity comes within IPM turn window. 

TRADE CONDITIONS
Condition: Bottom within IPM Turn Window  
Trigger: Rally above SP500 = 1789, DJIA = 15790, Russell 2000 = 111.5, Global Dow = 2401
Supporting Indicators: Up trend (8/4 did not complete), Next IPM can be either Top/Bottom

PROFIT TARGETS
Profit Target 1: 1870
Profit Target 2: 1930

RISK
Stop: Break below 1750 (valid till we are within IPM Turn Window)
Trailing Stops: Break below 1790 (SP500) and 15780 (DJIA)
Typical IPM Trade Matrix Risk: 1.5%
Actual IPM Trade Matrix Risk: 1.3% (Entry = 1813, Exit = 1790, Risk = 1.3% )
Risk Reason: There are multiple reasons to be worried: 1929 stock market parallel, 8/4 Test to the downside is in process (will be invalid at new highs) - almost invalid, and major IPM Bottom window in process - almost invalid.  

Applicable Rule (There are 7 Rules in the IPM Trade Matrix. Following are applicable to the market right now): 
  1. Do not go long or short without trigger to prevent losses by market moving against you.  
  2. Exit half at profit objective 1. Exit full at profit objective 1 if proprietary momentum continuation signals are not present.
  3. Observe stop-losses to minimize draw-downs

Note: IPM Trade Matrix Trades will be posted in the first half of 2014. This is an experiment to understand and enhance the capabilities of this Matrix.


For Blog updates on Google+ add: Understand Survive Thrive 
For Blog updates on Twitter, add: @survive_thrive
For E-mail updates: