
September was a volatile month in the markets.
If you look at the SP500 chart, it has been going sideways and frustrating many market participants.

As we mentioned in the last post, pretty much all the major asset classes have experienced sideways action over past month.
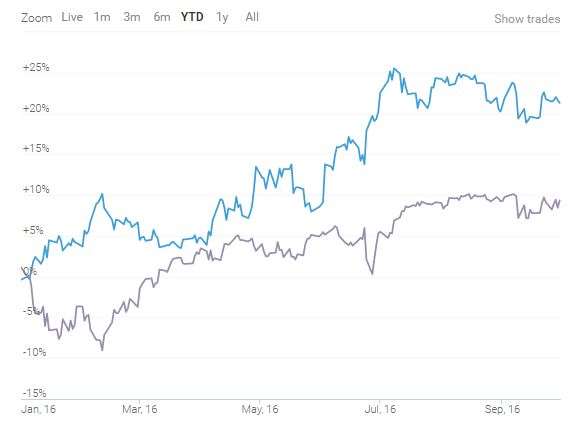
2016 has been a volatile year so far with markets declining sharply in Jan and February, followed by a nice rally. During these volatile times, our proprietary strategy has out-performed the SP500 by 16.3%.
SP500 Performance (Jan - Sept) = 7.8%
Conservative Strategy (Jan - Sept) = 24.1%
Cumulative performance since January in relation with SP500 (total returns) is shown below:

Monthly Performance:
Following chart shows monthly variation in performance.

Model is agile enough to take advantage of trend changes and re-allocate in strategic positions prior to big market moves.
All of these returns are for a portfolio whose current Beta is 0.32 and whose YTD Beta is -0.57, which means that these returns are totally uncorrelated with the market. Therefore, portfolio has a very high Alpha.

If you look at the SP500 chart, it has been going sideways and frustrating many market participants.

As we mentioned in the last post, pretty much all the major asset classes have experienced sideways action over past month.
2016 has been a volatile year so far with markets declining sharply in Jan and February, followed by a nice rally. During these volatile times, our proprietary strategy has out-performed the SP500 by 16.3%.
SP500 Performance (Jan - Sept) = 7.8%
Conservative Strategy (Jan - Sept) = 24.1%
Cumulative performance since January in relation with SP500 (total returns) is shown below:
Monthly Performance:
Following chart shows monthly variation in performance.

Model is agile enough to take advantage of trend changes and re-allocate in strategic positions prior to big market moves.
All of these returns are for a portfolio whose current Beta is 0.32 and whose YTD Beta is -0.57, which means that these returns are totally uncorrelated with the market. Therefore, portfolio has a very high Alpha.
If interested in free e-mail list or in paid services, please fill-out the form below.
No comments:
Post a Comment
I would love to hear from you! Please leave your comment below!!