
Market Overview
Today's market action provided some clarity into what market wants to do. Markets triple digit gyrations are very effective in rooting out weak hands, who base their trading on hunch and lack systematic execution. Yesterday, I did an analysis into market psychology around turn points and the associated losses that traders incur during this phase.
After current trade is complete, we might hold a live seminar to discuss this psychological analysis on the blog. This analysis will help in understanding why market moves in erratic manner near turn points and how this movement ensures maximum pain among market participants.
Recent market action suggests that something big is about to happen in the markets, in the next few days. Several markets have just started breaking down in the 3rd waves. If this pattern continues, we will have see sharply lower prices in the near future.
SP500: SP500 completed a 8/4 test to the downside in April. Since then market has rallied in a choppy format. The best count which supports a bearish outlook is shown below. It suggests that the SP500 is tracing out an ending diagonal pattern, which is a part of an expanding flat ABC in the 2nd wave. Today's market action shows that the ending diagonal was completed with a truncated 5th wave. Following chart shows the ending diagonal as being completed. Typically, when an ending diagonal is completed, a sharp decline ensues.
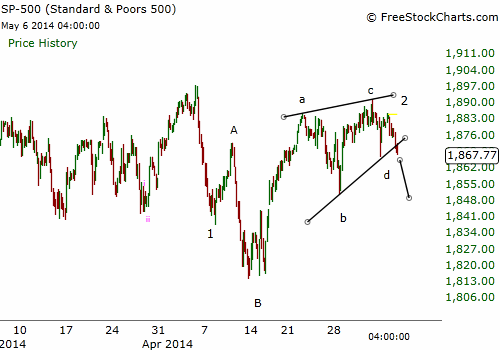
In order to keep the 8/4 test and above mentioned pattern valid, market should not make a new high above early April top at 1897.
Nasdaq: Nasdaq's decline out of mid April intermediate-term top has been clear 5-wave affair. Nasdaq has rallied impressively over the last few days and has come very close to breaking the mid-April high. As long as mid-April high is not broken, we remain in a downtrend and look forward to a decline into the IPM turn window.
 |
| May 1, 2014 |
 |
| May 6, 2014 |
All of the above developments suggest that we are approaching a turning point.
IPM Trade Matrix 2014 Trades
TRADE - 1: (Long) = +2.6%
TRADE - 2: (Short) = +9.3%
TRADE - 3: (Long) - Non IPM Trade Matrix trade = -0.2%TRADE - 4: (Short - 1/31/14 to 2/5/14) = +7.25%
TRADE - 5: (Long - 2/11/14 to 2/22/14) = +9.8%
TRADE - 6: (Long - 2/22/14 to 3/07/14) = +11.7%
TRADE - 7: (Long - 3/18/14 to 4/11/14) = -18.1%
TRADE - 8: (Short - 4/23/14 to 4/28/14) = +11%
TRADE - 9:
Bought TZA at 17.35. This is an aggressive short position. Shorts were added on 4/30 and 5/2.
TRADE CONDITIONS
When: Outside of IPM turn window in a downtrend - Date info e-mailed to subscribers
When: Outside of IPM turn window in a downtrend - Date info e-mailed to subscribers
Next IPM Turn Window: Bottom
Trigger: SP500 = 1881 (Aggressive), DJIA = 16520 (Aggressive), GDOW = 2519 (Aggressive)
Supporting Indicators: 8/4 Test completed to the downside. Downtrend in effect.
Trigger: SP500 = 1881 (Aggressive), DJIA = 16520 (Aggressive), GDOW = 2519 (Aggressive)
Supporting Indicators: 8/4 Test completed to the downside. Downtrend in effect.
PROFIT TARGETS
Profit Target 1: 1830
Profit Target 2: 1770
RISK - Defined above in the commentary
Stop: SP500 = 1898 , DJIA = 16682 , GDOW = 2536
Trailing Stops: -
Typical IPM Trade Matrix Risk: 1.5%
Actual IPM Trade Matrix Risk: - (Entry = 1881 , Exit =1885 , Risk = 0.2% )
Risk Reason: Risk is high because we are outside of the IPM turn window. This makes it difficult to time the turn exactly.
Applicable Rule:
- Sell (1/2) at profit objective 1 to minimize draw-down
- No Trade in opposite direction
- Do not go long or short without trigger to prevent losses by market moving against you.
- Observe stop-losses to minimize draw-downs
- If stops are hit ==> Wait on the sidelines for new opportunity near IPM Turn window
For Blog updates on Google+ add: Understand Survive Thrive
For Blog updates on Twitter, add: @survive_thrive
For E-mail updates:

No comments:
Post a Comment
I would love to hear from you! Please leave your comment below!!