Twitter

Friday, September 30, 2016

Sideways Consolidation nears End

Market's sideways movement continued. This sideways action is now 2.5 months long. SP500 has gone sideways in the last 2.5 months, as shown from teh chart below:


SP500 was at the level where it closed yesterday on July 12, and since then it has gone sideways. It is like a coiled spring, waiting for an explosive move.

At the same time, longer term DJIA structure also looks like a market consolidating before next rally phase.


From market structure perspective, seems like DJIA is tracing out an ending diagonal which is near completion. Market might require one more decline before putting in a substantial bottom.


This sideways action has removed a lot of optimism from the market and pushed many investors on the sidelines. According to Market Classification Model we remain in an uptrend. And this consolidation should be treated as a buying opportunity till the time, market turns and shows that the trend has reversed.

If interested in free e-mail list or in paid services, please fill-out the form below.

Thursday, September 29, 2016

Inverted Head and Shoulders pattern abound

Even though the market declined in the beginning of this week and scared away many market participants, who had just recently entered the markets, market is now again near all-time highs. But this time, markets are sporting inverted head and shoulders patterns.

Inverted Head and Shoulder patterns are bullish patterns. They either suggest trend reversal or trend continuation after consolidation. Once this pattern is complete, we can assume that the sideways action of the past 2 months has been completed and we are not on the verge of a substantial rally.

Following chart shows the inverted head and shoulders pattern in SP500:


A rally above 2200 level and holding that price will suggest that the market has broken out. Target of this pattern is at least 2275. However, this pattern could result in significantly higher prices because we will enter a very bullish part of the market rally i.e. 3rd wave ascent.

We have been discussing this potential Head and Shoulders pattern for the past few weeks. Following chart was shared on September 20th, highlighting Nasdaq 100 performance and potential Head and Shoulder formation:


Since then the Nasdaq 100 index broke above the neck line and has now completed a successful test of the neck line. Following chart shows the performance of Nasdaq with recent market data filled in:


Overall market trend remain up, as per Market Classification Model. We use MCM to identify the trend and it has kept us on the right side of the market for a very long time now.

If interested in free e-mail list or in paid services, please fill-out the form below.


Thursday, September 22, 2016

Correction Complete - Approaching Vacuum

Near term market structure suggests that market has just completed a correction. With intermediate trend up and recent sell-off triggering several buy signals, it seems like we are on the cusp of a major rally.

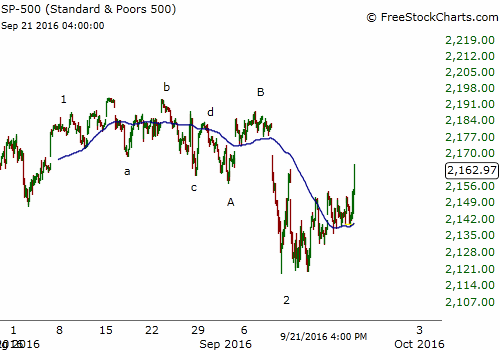
Following chart shows the correction count, since early August.


Since August 8th markets have gone sideways. This sideways action culminated on 9/9 with 400 point decline in DJIA. If the market had rallied right after September 9th bottom, people would have accepted this bottom easily. But sideways action over the past week of so with federal Reserves uncertainty really pushed many market participants out of the market.

Next wave would be wave -3 and a sharp rally. Furthermore, market is now entering Vacuum territory.

Vacuum in Nasdaq
After consolidating near all-time highs for almost 2 years, Nasdaq is about to really break out. This break above 16 year highs, puts Nasdaq in unprecedented territory.

Following chart shows that there is Vacuum above this level and could suck the market higher and leave many of the market participants behind.


Believe me its a very difficult thing to buy at all-time highs. And that's why we developed a strategy to align with the trend with proprietary Market Classification Model, in conjunction with tactical allocation and strategic evaluation. This model has performed amazingly well since it's launch on January 1, 2016 (Performance). 

If interested in free e-mail list or in paid services, please fill-out the form below.


Federal Reserves and Market Action

The Fed announced holding the rates and provided guidance for potential increases in future. It wasn't anything out of the ordinary. It was highly unlikely for the fed to raise rates at such time before the elections. However, the more interesting reading came from the dot-plot.

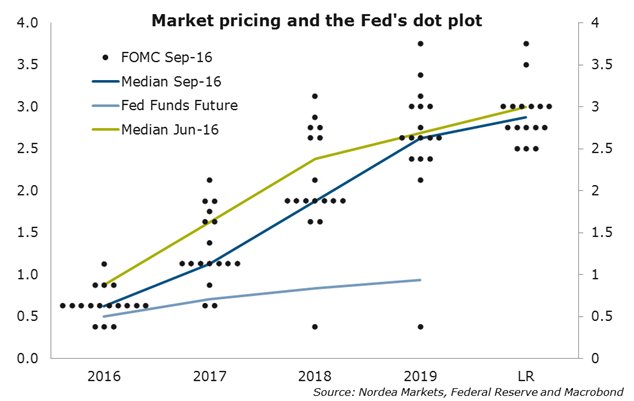
Fed uses this plot to provide guidance regarding future interest rate path. Median of the dots show a curve where Fed officials believe interest rates should be over the next few years.

Following chart shows the plot:


Along with the dot plot, above chart also shows the median projections for the next few years as taken in June and September. As one can see these estimates have come down a lot. As a result, the expectation of interest rise have also decline.

Once this expectation declines, it gives was to higher bond prices and lower yield. At this time, higher bond prices would mean more liquidity, thus being favorable for the overall asset class complex. This situation will surely change one day. For now, we are in an uptrend. In yesterday's analysis on Pre Fed and Bank of Japan announcement, we shared same outcomes

Market Classification Model has been bullish on Bonds for years now. And it seems like there is no reason to bail-out on bonds just yet. Even though many financial gurus have been predicting an inevitable bond demise, which will happen one day, current situation is supportive for a bond rally. As long as trend remains up, forecasts for bond collapse will not come to fruition. Therefore, it's imperative that one remains with the trend.

At Understand, Survive and Thrive, we use Market Classification Model to stay aligned with the trend. MCM is an algorithm based on some of the most time-tested market indicators and their inter-relations to determine when the trend changes, so that we don't stay on the wrong side of the trend for long.

If interested in free e-mail list or in paid services, please fill-out the form below.

Tuesday, September 20, 2016

Strategy Performance

Our proprietary model has been performing very well so far this year. Even with recent 2.5 month sideways consolidation, model is up 22.1% vs 6.3% rise in SP500. We will continue to monitor the performance of this model and share updates. This model will be available for investors to replicate or invest in towards the end of the year.


If interested in free e-mail list or in paid services, please fill-out the form below.


Technology getting ready for a Break-Out

While the US markets have been going sideways, Nasdaq has traced out an inverted head and shoulders near all time highs (shown below):

These highs are 16 years old and there is vacuum above this level. If this pattern holds, we can expect a sharp rally in the near future. This rally can start in parallel with central banks announcements or it can start after a decline following Federal Reserves announcement. In any case, this is a very positive development for the market.

If Nasdaq can lead the market, we can be sure that the overall market will follow and that the recession talk will substantially subside. According to Market Classification Model, we remain in an uptrend. Uptrend typically results in rallies and market participants find reasons to be bullish even in front of negative news.

If interested in free e-mail list or in paid services, please fill-out the form below.


Bank of Japan and Yen

From Bank of Japan perspective, they would like Yen to decline because that was the catalyst to push Nikkei higher couple of years ago. Right now, Commitment Of Trader data (shown below) shows that the market is ripe for another decline in Yen, which means that its likely Japan will reduce interest rates further or introduce some sort of monetary stimulus.


If BoJ stimulates the market and forces a decline in Yen, we can expect a rally in the indices.

If interested in free e-mail list or in paid services, please fill-out the form below.