Twitter

Thursday, June 23, 2016

Stock Market - Bear Case

Although both Bull and Bear scenarios are equally important, I would personally like to see the Bull scenario unfold because it helps everyone and the economy. However, let's first discuss the potential bear setup, especially at a time when the market is rallying ahead of the Brexit results. 

Bull or Bear, market will soon adopt either direction. And July's Q2 earnings will justify the move. 

As of now, markets are in a neutral territory. Last time, our proprietary Bull/Bear model went neutral was in August and since then we have been out of stocks. In January, model went short for 3 months and is now again neutral. We have seen that markets have not managed to break-out in over a year. For some market observers this is a sign of accumulation or digestion of prior gains an will result in further gains, but let's not forget what happened to oil.

Following charts shows SP500 and Oil. Oil went sideways for 3 years (2011-2014). While many believed that this sideways action was a harbinger for future rally, Oil fell off the cliff - from $110 - $25.


Can this happen to stocks? Probably... 

In support of the above argument, following chart shows a potential Elliott Wave count in Global Dow index, which suggests that the markets are about to fall in a big way in 3rd wave down.


Now, Elliott Wave analysis is only valid when its accompanied by market internals and sentiment. As of now, the sentiment indicators are bullish which reduces the market's fuel for a sustained rally. At the same time, Commitment of Traders, especially in Dow Jones Industrial Average, is at a very elevated level. This typically coincides with a top or pause (shown below).


Conclusion
This analysis shows that the market is near the end of its up trend. However, that's just one side of the story. In our prior post, we also highlighted potential Bull reasons and we will discuss these further in the next few posts. 

As for the portfolio allocation, proprietary model will define the allocation based on key proprietary indicators and latest macro-economic developments. In any case, the model will quickly align itself with the new reality and market dynamics. 

Wednesday, June 22, 2016

Stock Market - Bull and Bear Case

There is a lot of uncertainty in the financial markets right now. Typically such uncertainties help in building a wall of worry, which bull markets like to climb.

However, the problem with focusing on uncertainties is that one loses the better things in the translation. For example, right now global financial media is focused on Brexit, it will then focus on Fed's interest rates, China issues, US elections or some other issue. At the same time, low unemployment, stable economy and a year of sideways gains digestion is totally ignored.

Second set of items listed above clearly highlight the positives going on in the market. Therefore, its paramount to see the markets from an objective perspective. Please note that just seeing is not enough, seeing has to be coupled with action. And that's why many analysts who are right on the overall economy or future market direction, end-up losing money in their portfolios.

As part of this objective analysis, we have been discussing various markets on this blog. This week we will focus on the stock market because there are several reasons for the market to rally and to fall. As a result, I have decided to document following positive and negative aspects of the market in the next few blog posts.

Positives
  1. Its been more than a year since last market high. History suggests that if the market rallies after such a development to new highs, we can expect continued gains
  2. Narrowing/coiling long-term technical indicators, suggesting fuel is being built-up
  3. Elliott Wave analysis
  4. Proprietary Bull/Bear model approaching a break-out
  5. Rising cash positions in funds and equity outflows
  6. No divergence in advance-decline line
Negatives
  1. Extremely high Commitment of Traders (COT) bullish bets 
  2. Not a lot of pessimism in the sentiment surveys
  3. Potential Elliott Wave count
In either case, next market move is upon us. It will be a sharp and sustained move. Therefore, we need to position in a way so that we can benefit for such a move.

The proprietary model portfolio is up ~15% YTD in a year where SP500 is up ~3% after dividends. We will continue to pursue the model and allocate strategically to benefit from sharp market moves. 

Please feel free to add how you feel about the market in the comments section or on twitter @survive_thrive


Monday, June 20, 2016

Performance Evaluation - June 17, 2016

Brexit fears continue. Market's declined last week with VIX spiking and generating a buy signal, which is being played out today with a sharp rally.

According to financial media, the catalyst for this rally is easing Brexit fears. However, Brexit is just one part of the equation. There are more fundamental issues with the economy, which people are ignoring. We will talk about these issues in the next few posts.

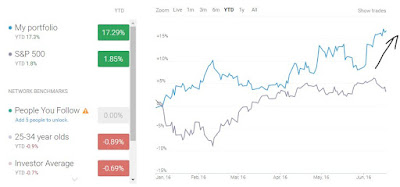
While the market and economy is now starting to face the reality and is under-performing, our prop portfolio is doing extremely well. As of June 17th, the model is up 17.30% based on real money performance tracked by OpenFolio (seen below). 


This month's gain has triggered a 'Go to Cash' signal for a small portion of the portfolio.

Following are few interesting observations:

  • Model rallied back sharply after May's decline
  • Model's asset weighted Beta correlation to the market is -0.06, which means that the underlying portfolio components are not linked to the market performance.
  • Model's internal risk management metrics allow us to capture gains and adjust portfolio in case of evident anomalies.
Please feel free to contact us with any questions. Feel free to share any questions on @survive_thrive (good place to have conversations!)

Monday, June 13, 2016

Portfolio Performance - June 10, 2016

Next week will be full of market moving news ranging from 3 Federal banks (US Federal Reserves, ECB and B of Japan) to Brexit. In the midst of all of this uncertainty, market is struggling to break the 2130 level, which has acted as a ceiling for the past 12 months.

While economic uncertainty might keep the Fed from raising rates, it will also keep the stocks from rallying. As a result, its time to diversify into other asset classes.

Diversification has allowed the  "Portfolio Enhancement Model" to beat the market by more than 10%. Following chart shows the comparison of SP500 (total return) with Portfolio returns:


This performance is governed by strategic asset allocation, effective risk management and impactful diversification.


Wednesday, June 8, 2016

Stocks, Bonds and Gold - All Moving Higher

It's an interesting time in the market since last week's employment numbers. Stocks, Bonds and Gold, all are moving in lock-step. Although its very possible because different market dynamics govern each asset class, its unlikely.

Bonds are typically considered safe havens as they are less volatile and move in the opposite direction of the risk assets. At least that's the common perspective. Gold has a similar attribute. Even though historical patterns suggest that this notion of inverse correlation of Bonds and Gold with Stocks is contrary to what actually happens over long periods of time.

Recently these three asset classes are moving together, as shown below:


This correlation started from the Jobs report. It seems like everyone is happy that the Federal Reserves won't raise rates, and therefore, all assets are being purchased. However, this pattern cannot sustain for a longer period of time. And something might give.

Since Gold and Bonds are in a bull market, while stocks aren't in one, according to proprietary indicators, Stocks have the most risk right now. We have Federal Reserve's FOMC meeting next week. This meeting could really shake the markets.

So what does this really mean for investors and traders:

  1. STOCKS: Long terms investors be wary of stocks till they can break to new highs. Although US stocks have been doing relatively well, they have huge drag from the global markets. Its unlikely for US market to break-out at a time when global macro conditions are not supporting with positive underlying currents. Therefore, stay away from this risky and over-valued asset class.
  2. BONDS:  Uptrend remains intact even in the face of all the negative press that bonds have received over the past few weeks, suggesting that bonds have peaked. However, bonds' short-term peak is approaching. So if you can refinance at this rally, its a good time to do so.
  3. METALS: Precious metals entered a bull market after a long bear and have a long way to go.
Let us know if you see any other interesting correlations in the market.

Sunday, June 5, 2016

Portfolio Performance - May 2016

In the month of May, portfolio experienced ~5% decline while SP500 return 1.8% including dividends. Even though portfolio under-performed against the SP500, it is still up more than 9% YTD.

Portfolio's YTD performance with daily variation is shown below:


Absolute performance is just one measure of success of any portfolio. there are several other measures used by the finance industry that classify the performance of any portfolio in regards with the amount of risk taken and its correlation to the underlying stock market.

On these measures, the portfolio has outstanding returns. Portfolio's weighted average Beta is -0.05, which means that Portfolio returns are totally uncorrelated with the markets. As a result, portfolio will generate excellent Alpha because the returns are totally independent of the Benchmark returns. Secondly, the portfolio has a Sharpe Ratio of ~3. This shows that the risk adjusted returns are excellent.

Lastly, the portfolio is positioned in a way that it will benefit from upcoming market developments. For example, impact of poor May employment report and its impact of asset classes.

Please note that historical analysis has shows that the model's worst draw down was ~7%. Therefore, it means that we are close to a point where the portfolio will again start to outperform the market.

We will discuss market development in upcoming posts.

Monday, May 2, 2016

Benefits of Model - Part 4

Over the past few weeks, we have analyzing the performance of our proprietary algorithm and its non-financial benefits. 

In addition to amazing returns, one other benefit that we would like to highlight is the ability to utilize Buy and Sell strategy. This benefit is in addition to the following benefits that we have analyzed in detail as part of Q1 performance evaluation:

  • Peace of Mind
  • Less Stress during Market Volatility & Eliminating Emotions
  • Trend/Momentum following ability
  • Diversification
  • Positioning for next market move


7. Buy and Hold Strategy

Buy and Hold strategy has numerous benefits both monetary and psychological. 

There are several types of monetary benefits:
1.    Long-term growth of prices
2.    Reduced tax rates
3.    Best form of tax deferred growth - if you don't sell, no need to pay taxes

If a person holds a stock holding fore more than 12 months, he has to pay 15% (20% in case of max tax bracket) capital gains taxes. On the other hand, if a person sell stocks in less than a year, capital gains are treated as short-term gains and result in taxes at marginal income tax rate. These kind of tax benefits really add-up when you consider long-term structure of investments.

Furthermore, the common understanding is that prices grow over very long periods of time and majority of gains occur in few days of trading e.g. days when market opens up 400 points. Therefore, if one is continuously holding stocks, they will most likely do well in the long-run (except for bear market).

From Psychological perspective, this strategy helps to reduce the following:
1.    Stress associated with daily market gyrations
2.    Pressure to act in face of declining or rallying prices

Portfolio Enhancement Algorithm allows the investor to benefit from above mentioned benefits of Buy and Hold Strategy without being compelled to act. This strategy has a plan, which will be implemented and will help with long-term capital gains, rather than short-term gains. As a result, one can reap both emotional and monetary benefits of the Buy and Hold strategy through Portfolio Enhancement Model.

In the next post, we will review some quantitative risk measures to highlight model's performance in relationship to various statistical risk measures.