Latest IPM Model update has been emailed to subscribers.

Utilize engineering psychology - creativity and ingenuity, to justify, debunk or combine different financial analysis techniques, providing quality/customized analysis to readers by introducing innovation in the financial world
Sunday, March 17, 2013
Tuesday, March 12, 2013
Market Thoughts - Rally Near Top
This post is in reply to the comments received on the blog over the past few days:
Market has been rising as expected over the last few weeks. DJIA has rose for 8 straight days. This not only shows the strength of this rally, but also highlights the fact that there were so many doubters of this rally when it started.
However, we are now approaching a point where market is nearing a near term top. In fact yesterday, for the first time in 3 weeks, no one on the Fast Money half time report mentioned a correction. This can be a small contraion signal (Fast Money = Small Signals b/c fast traders).
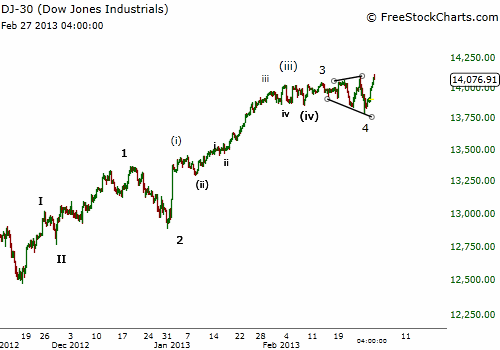
In Elliott Wave terms we are in process of forming minor wave 4 (chart will be posted over the weekend). This could result in another decline tomorrow. But once this decline is complete, we could rally for another 2-4 days. Along with EW count, there are few other reasons to support this assertion:
1- We have not received a Sell signal from our indicators
2- IPM Model is calling for a bottm at the next trun date, which would require market to top soon
3- Today's decline has again brought out a good number of bears, who are calling the top. I have made this kind of mistake in the past. Market rarely rewards traders who are early to the topping part in a Bull market.
4- Fed Meets next week
In any case, once we make a new high and possibly a new all time high in SP500 later this week or early next week, we will see a sharper decline. Which will again bring out the Bears.
This market has proven to me why Bull markets keep on rising: Even at new All Time Highs, people and analysts keep on calling for correction!!
Although I am busy with some stuff till Friday, keep the conversation going and I will try to give my 2 cents.
Market has been rising as expected over the last few weeks. DJIA has rose for 8 straight days. This not only shows the strength of this rally, but also highlights the fact that there were so many doubters of this rally when it started.
However, we are now approaching a point where market is nearing a near term top. In fact yesterday, for the first time in 3 weeks, no one on the Fast Money half time report mentioned a correction. This can be a small contraion signal (Fast Money = Small Signals b/c fast traders).
In Elliott Wave terms we are in process of forming minor wave 4 (chart will be posted over the weekend). This could result in another decline tomorrow. But once this decline is complete, we could rally for another 2-4 days. Along with EW count, there are few other reasons to support this assertion:
1- We have not received a Sell signal from our indicators
2- IPM Model is calling for a bottm at the next trun date, which would require market to top soon
3- Today's decline has again brought out a good number of bears, who are calling the top. I have made this kind of mistake in the past. Market rarely rewards traders who are early to the topping part in a Bull market.
4- Fed Meets next week
In any case, once we make a new high and possibly a new all time high in SP500 later this week or early next week, we will see a sharper decline. Which will again bring out the Bears.
This market has proven to me why Bull markets keep on rising: Even at new All Time Highs, people and analysts keep on calling for correction!!
Although I am busy with some stuff till Friday, keep the conversation going and I will try to give my 2 cents.
Thursday, March 7, 2013
New Highs & New Wall of Worry
Most U.S. Markets have
reached all-time highs, except for SP500, which will most likely surpass its
highs in the near future. Although this is a monumental achievement for the
U.S. markets as they overcame losses of the Great Recession, the response from
market participants and investors has been lackluster. News coverage has been
anemic, sentiment surveys are not euphoric and there is no trust in the market
among blog writers. This kind of behavior not only highlights the strong wall
of worry that is in place in the financial markets, it also suggests that we
will be seeing higher highs in the U.S. indices in the coming weeks.
There are two things
about markets that always fascinate me:
- Markets do what is least expected by the
majority.
- No matter what one says about fundamentals being bad, markets
are always right because price pays not the opinion.
Keeping these two
important points in mind, through experience I have realized that there is no
one good method of analyzing the markets. In some cases, one indicator will
suggest that the market is about to peak out, but others will be painting a
contrary picture. We can see a similar situation right now: Some sentiment
indicators are euphoric but others are pessimistic. For example, when market
reaches all-time new highs there is euphoria among the public, people talk
about it at offices and small investors start piling in.
Previously there used to
be celebrations on the NYSE trading floor when DJIA reached new all-time highs,
but this year there were no celebrations. In 2000 and 2007 there were news vans
outside of the NY Stock Exchange, but this time there were no news coverage
from global media (as per Art Cashin). Previously, financial news media was
calling for further gains and time to get back into the market after new highs,
this time media is suggesting a more cautious and how to protect yourself. And
finally, individual investors are now more pessimistic about the market than
they were 500 point lower in DJIA.
Some reasons behind this
abnormal behavior include:
- Bad experience in the last 12 years with new market
highs
- Political uncertainty, upcoming budget issues and
sequestration cuts
- European problems
Although these are grave
concerns, so far they have not kept the market from making a new all-time high.
In fact, one can call them distractions until they really start mattering. In
short, there is significant amount of pessimism in the market, which can help
propel the market even higher. Some of the fundamental catalysts that can help
in rising stock prices are:
- FED's bank stress test results - March 7
- ECB and BOE meeting – March 7
- Jobs Report on Friday - March 8
- FED FOMC meeting - March 20
Although fundamental events can hint
towards potential market moving announcements, they cannot tell us whether the
reaction will be positive or negative to the announcement. In this regard, the
market's Elliott Wave structure shows the path of market's near term move.
According to E/W structure, U.S. markets are in wave-5 of 3rd wave rise. This
wave can last for another 1-2 weeks and could top near FED meeting. Detailed
timing information has been e-mailed to subscribers via IPM Model update. As a
result, the assumption is that fundamental news will result in positive market
action.
IPM Model picked the November bottom, December bottom, January top and February bottom. Next IPM Model update will be sent
to subscribers on 3/15/2013.
Note: IPM Model has been a very informative tool for market timing.

Sunday, March 3, 2013
Sequestration & Near Term Structure
Long Term Structure (last post): Elliott Wave Case of a New Rally
Sequestration:
Understand, Survive and Thrive, predicted that Sequestration will take effect at the end of January's IPM Model update sent to subscribers. However, if some one thinks that we stating that Sequestration will be good for the economy, he is wrong. Because we do not belive that is the case. On the contrary, Sequestration along with New Year tax increases will be devastating for the economy!! But does it mean that stock market will go down right away? I do not think so because Sequestration's impact will not be felt immediately. Instead they will be felt over few months. This opens the possibility of near term market rally, followed by sharper decline during Summer.
Based on experience in markets, it is obvious that market
tries to confuse the masses before showing its true hand. One such situation is
happening right now. As Sequestration took effect, market is at a
crossroads in terms of its near term Elliott Wave structure. Although we have
already shown that according to the long term wave count markets have completed
Wave 4 and are on the verge of Wave 5 rally, near term structure
is being interpreted differently by different commentators.
Bullish interpretation suggests that after bottoming on February
26, 2013 market has rallied in a classic 5-wave manner. After a 5-wave rally,
market typically undergoes a deeper retracement. This correction normally takes
on 3-wave shape and last for few days. As per the bullish interpretation, Friday's Sequestration induced decline was the correction that should have followed initail 5-wave rise, and now we should start moving higher. SP500 structure is clearly labeled on the following chart.
 |
| DJIA - Up |
 |
| SP500 - Up |
This scenario flows very well with the Sequestration
deadline drama. As lawmakers failed to avoid Sequestration, markets experienced a sharp decline. Talking heads on TV and Internet started vehemently talking
about the negative impacts of Sequestration on the economy. I assume that this has created enough negative sentiment to push investors out of the market just in time for a sharp rally to possible all time high in some indices. Potential rally exhaustion time
frame has been sent to subscribers through the bi-weekly IPM Model update.
Sequestration:
Understand, Survive and Thrive, predicted that Sequestration will take effect at the end of January's IPM Model update sent to subscribers. However, if some one thinks that we stating that Sequestration will be good for the economy, he is wrong. Because we do not belive that is the case. On the contrary, Sequestration along with New Year tax increases will be devastating for the economy!! But does it mean that stock market will go down right away? I do not think so because Sequestration's impact will not be felt immediately. Instead they will be felt over few months. This opens the possibility of near term market rally, followed by sharper decline during Summer.
Bearish Elliott Wave interpretation suggests that the recent rise was a
part of larger 2nd wave, with 2nd wave being sub-divided
into A,B,C. This count is shown on SP500 chart below. Although this count
is valid for some markets, it is not valid for DJIA.
 |
| SP500 - Down |
A lot of Elliott Wave practitioners are proposing this count to suggest that we are about to fall off a cliff due to fundamental reasons defined above. Since they have thousands of followers, it is highly likely that their interpretation will be wrong. Recent deterioration of optimistic
sentiment, obvious sequestration scare, internal market strength, and IPM
Model turn date, supports the fact that market should rally further.
As I have mentioned previously, the Elliott Wave market
structure evolves over time and one does not
know the real structure until it is fully completed. Even then it can morph
into something else. Therefore, we need to incorporate other proprietary
methods like Market Matrix, IPM Model and Trading Algorithm to decipher the
true market structure. Latest IPM Model update was e-mailed to subscribers on March 2, 2013 (yesterday).
Note: IPM Model has been a very informative tool for market timing.
Friday, March 1, 2013
Elliott Wave Case of a New Rally
February has been quite a month. UST IPM Model suggested
that investors should exit the market on or around Jan 28, 2013. Since then market has
gone net sideways. Some markets have significantly declined, while others
managed to crawl up in the first 2 weeks of February before declining sharply.
As Joseph correctly said in one of his comments a few weeks
ago, “no matter what you say, we are in a correction.” As we know that
corrections are overlapping and can take any of the 11 possible Elliott Wave
shapes, it is difficult to predict the exact shape of a correction. But all markets had one thing in common, they had overlapping and choppy charts. This kind of behavior is a classic
description of Wave 4 in Elliott Wave terms because Wave 2s are typically
sharp and deep.
Although UST subscribers knew about the potential bottom date in February, it is an appropriate time to reevaluate the market structure
to see where we are and where the markets are headed. This structural analysis
has kept us on the right side of trade since March 2012. In January 2013, it was
stated in IPM Model update that we need a series of 4 and 5 waves to
complete this rally and that is what we have got.
The first chart below shows DJIA and its wave structure since Nov
2012 bottom. DJIA rose in a clear impulsive manner from Nov 2012 low to January
2013 high. At that point we needed a 4th wave. It appears like DJIA traced out an expanding triangle pattern in February. Triangles typically take
place during 4th waves and represent consolidation before
continuation in the prior direction. This chart clearly shows the rally
potential of DJIA as we approach the IPM Model bottom date.
2nd chart shows the market performance from IPM Model top to IPM Model bottom. As one can clearly see, market has undergone one month of correction, and is now ready to break out of this range.

Thrird chart below shows SP500 pattern since Nov 2012 bottom. It
shows a similar picture as DJIA, except for the fact that in SP500 we do not
have a triangle. Instead we have a clear 3 wave decline from February top to
February bottom. In January IPM Model update, it was mentioned
that due to internal strength of the rally that we have witnessed since
November, it is likely that market could continue higher till mid-February
before declining to complete 4th wave (sent to subscribers).

This wave structure (impulsive rise, followed by a 3-wave decline) is in harmony with the new Bull market
thesis presented to UST subscribers in early December 2012. In the next update,
we will discuss the near term market structure and associated market signals
which are suggesting that markets has already bottomed.
Note: Next IPM Model update will be e-mailed to subscribers on March 3, 2013. IPM Model has been a very informative tool for market
timing.
Tuesday, February 26, 2013
Bonds Technical and Sentiment Picture
Following post was written on Sunday night but was not published due to logistic reasons. Yesterday's market action has further solidified the rally argument. It could have far reaching consequences for the stock market (we will discuss those later). In the mean time, I would like to again humbly Thank God, who enabled the IPM Model to predict this decline in the stock prices and allowed us to stay out of the market. IPM Model predicted the bottom at the next IPM Turn window in January, after which all of the subscribers exited the market, with a goal to buy back at lower prices. Past reports will be published in March. (Subscription Information)
For the last few days, we have been discussing the Bond market. Bond prices bottomed on Feb 1, 2013, and have since been going sideways. This sideways action can mean two things:
1- Market is getting ready for another decline
2- Market is tracing out a base before breaking out.
In order to better understand bond market's recent price action, one should look at the bigger picture and the long-term bond market structure.
Long term Structure:
Long term Bond market structure clearly shows that Bonds have been declining since July of 2012 (almost the same time when stock market started going up in summer). This decline has traced out a clear 3-wave (A,B,C) structure. Furthermore, the structure is not impulsive at all, with wave A sub-divided into 3 waves, wave B sub-divided into 3 waves and wave C ongoing. As we know that 3-waves are corrective in nature, therefore, it is highly likely that the Bond market will very soon complete its correction (might have already completed its correction) and start a sharp rally.

Near term Structure
Their are two alternatives:

Their are two alternatives:
- Bond market has traced out a ABC correction to the upside since early February. Within this correction every wave is sub-divided into 3 waves. However, the sub-component of C-Wave have the following composition (A=5 waves, B=3 waves, C=5 waves). This would mean that we need another decline to complete the long term structure.
- Bond market has just completed a series of 1's and 2's, and will soon start rallying sharply in wave 3 of 3. This wave count is based on the bond market tracing out a series of 5 waves in up moves since Feb 14, and tracing 3-waves during corrections.This alternative is supported by the pessimistic sentiment towards bonds.

Critical Level:
Bond market should not break below Feb 14 lows to hold the rally assumption.
Sentiment:
The sentiment picture towards Bond's prospects if very grim, which suggests that there is a lot of fuel to propel a bond market rally. One of the biggest argument that we have been listening to in regards with the new Bond Bear Market is related to the concept of "The Great Rotation." According to this argument people will start taking their money out of Bond funds and will put in stock funds, which will result in a decline of the Bonds and rise of the Stocks. However, this argument is not only flawed, it is a great contrarion indicator because when every one accepts a reasoning, it typically fails to materialize. We have discussed Bond market impact in detail in the following post:
Secondly, recently FED stated in its minutes that they will start debating their QE infinity program. This announcement sent both Bonds and Stocks down. However, this announcement can be taken as a contrarion indicator on the part of the Bond prices. As many investors are assuming that FED's exit from buying bonds will be negatives for the Bond prices and hence selling their positions, this announcement might be a contrary buy signal. We have discussed FED's impact on Bond and Stocks in detail on the blog here:
The commitment of traders data of the Bond market suggests that Commercial Hedgers (big banks) are net long and Large Investors are very short. The Large investors have historically been wrong about the market's direction. Therefore, this is another catalyst t propel the Bond market rally.
Finally, Bond sentiment as measured by several sentiment measures is at multi-year low, with a composite measure of surveys recording among the lowest bullish opinion in a decade. This observation is again very bullish for the Bond market.
Conclusion:
Pessimistic sentiment in the Bond market supports the Bullish argument. Therefore, we should be vigilant of a new bond rally, with pre-defined risk above the critical level.
What Great Rotation?
FED's Minutes: Bonds or Stocks?
The commitment of traders data of the Bond market suggests that Commercial Hedgers (big banks) are net long and Large Investors are very short. The Large investors have historically been wrong about the market's direction. Therefore, this is another catalyst t propel the Bond market rally.
Finally, Bond sentiment as measured by several sentiment measures is at multi-year low, with a composite measure of surveys recording among the lowest bullish opinion in a decade. This observation is again very bullish for the Bond market.
Conclusion:
Pessimistic sentiment in the Bond market supports the Bullish argument. Therefore, we should be vigilant of a new bond rally, with pre-defined risk above the critical level.
Subscription
If interested in IPM Model Subscription, please fill out the form below. Subscription details are in the subscription tab.
Sunday, February 24, 2013
Bond Price Relationship
This is the 2nd post on this Topic. First post gives a background about Bonds and their pricing strategies. It can be read here.
Reasons for Bond Price rise (Both of these reasons are valid for the US Bond Bull market):
- Prices will rise if interest rates go down e.g. Federal Reserves lowers the interest rate or we have deflationary pressures.
- Prices will rise if there is extra demand (supply/demand curve - Higher Demand = Higher Price). This typically happens under two scenarios: 1- Economy is doing well, and people feel that they will get the returns promised by the country. As a result, they buy bonds as investment (Economic Confidence Trade). 2- Everything else is doing so bad that investors don't have any choice but to buy bonds (Fear/Safety/Risk off Trade).
These reasons can be inverted to suggest why Bond Prices Fall:
- Prices will decline if interest rates go up e.g. Federal Reserves increases the interest rate or there are inflationary pressures in the market. Inflation typically happens in a good/robust economy (not always).
- Prices will decline if there is lesser demand (Supply/Demand curve - Lower Demand = Lower Price). This typically happens under two scenarios: 1- Economy is doing very poorly, and people feel that they will not get their money back from the country. As a result, they will dump their bonds (This was seen in Europe in 2012, where the Bond prices fell along with the Stock Market, and the yields reached 6% for some countries, which had to seek bailout funds). 2- Everything else (commodities and stocks) are doing so good that investors don't have any choice but to sell bonds (Rotation/Risk on trade).
Based on the above mentioned explanation, lets analyze the U.S. Bond market.
US Bond market has been going up because U.S. Bonds were considered safe haven during the financial crisis of 2008 and during the 2012 European crisis. This situation was further amplified by Federal Reserves extra low interest rate policy, and the subsequent QEs. Finally, there is a 30 year cycle in the Bond Markets. This cycle bottomed in 1980 and will be topping out soon. All of the above reasons have contributed towards a Bond Market's Bull run.
Bond's Relationship to Stocks:
Some argue that when Bonds go up Stocks go down (inverse relationship) because investors (small and large) shift their investments from bonds to stocks (Rotation / Risk on trade). This is the same argument that is being given right now in the form of "The Great Rotation." According to this thesis people will sell their bonds, and will put money into the stocks.
However, the inverse relationship is not true in the long term. For example Bond Bull is started in 1980, but during this time we have seen a secular Stock Bull Market (1982 to 2000) and are now witnessing a secular Stock Bear Market for the last 13 years (2000 to Present). As mentioned above, it is also possible for stocks to decline in sync with bonds. This will happen when people lose confidence in the government (recent European Example).
Current Situation:
Commodity markets' price action is suggesting Deflationary pressures are coming back. Deflation means bad economy and lower yields due to both poor economy (safe heaven trade) and low inflation rate. Lower yields result in higher bond prices. This would negate the concept of "The Great Rotation." In fact, this might suggest that stocks might soon experience a decline. For all those who have been patiently waiting to short bonds: That time will come (probably within 1-2 years), but it seems like its not now!!
Subscribe to:
Posts (Atom)