Twitter

Wednesday, August 31, 2011

Markets Rally - UST Manages

In the name of God, the most gracious, most merciful

Hopefully you followed the UST Inflection Point Model's August 23, 2011 Bottom Call. If yes and you had held the markets then you will be sitting on a handsome 7% profit in 1 week.

For further understanding of UST Methodology, Please Review:

  1. Latest Trading Algorithm Update (Especially Important! Deals with today's market)
  2. Our Market Timing history
  3. Trading Algorithm Review
  4. Predicted vs. Happened

Next publication will address the reasoning why we might have entered a long-term rally phase. As always Bull or Bear Risk-Management is paramount.

In the meanwhile, view this interesting Rollercoaster ride of Inflation Adjusted Housing Prices represented by Case-Shiller Index from 1890 - 2010. (Years appear at the bottom of the window as the rollercoaster moves along)


If you like the analysis, Book your Subscription Spot  

(Only 28 spots left) 

Tuesday, August 30, 2011

Trading Algorithm Update - August 30, 2011

SP500 (Closing as of August 29, 2011) = 1210

Market: Bear to Neutral
Defining Level: 1207
Trend: Down
Defining Level: 1282
4/8 Trend Change Confirmation (Down to Up): Not Yet
Current Trade: Half long from 1167 and half long from 1196. Long Cost Basis: 1181
Profit Objective 1: 1216                                                Trailing Stop (closing): 1166
Profit Objective 2: 1250                                                EW Stop: 1179
Status: Long from 1181 (average). Hold long till profit objectives are achieved or stops are hit
Next Trade / Model Based Approach: Will be determined as current trade matures in 1-2 weeks
Stop:                                                                                  Risk: 
Risk Associated with trade: 
Turn Window: August 23 (+/- 4 days) รจ
Market bottomed in the turn window. We are now out of the turn window
Scenarios
1-       Market bottoms in turn window
2-       Market tops in turn window
3-       Market double bottoms and breaks out
4-       Market double tops and breaks down
Observations:  After one week of extra-ordinary market action, it is evident that the markets did bottom within the turn window. This observation in conjunction with a new found Wall of Worry, evident through investor sentiment surveys and news articles, suggests that we might be in for a solid rally. As mentioned previously, sentiment has been our best guide - identifying whether to buy the dip or sell short. Furthermore, recent market action in the financials and the small caps, is also very encouraging. At the start of significant rallies/Bull markets, these two groups outperform the broader markets. Since last week's bottom, Financial (XLF) have risen 12.6% and Small Caps (Russell 2000 - IWM) have risen 12.1% VS. SP500 rise of 7.8%. With next turn date in September, we have a rally window of around 2/3 more weeks. All of these observations suggest that we have seen a significant bottom in the financial markets. 

At this point, SP500 should hold above 1168 (closing) to keep the uptrend intact. As far as the bear market determination level is concerned, 1207 is the latest defining level generated by the Trading Algorithm. Right now, most indices are bumping their heads against this level. If we close above this level for 2 days then Trading Algorithm will switch to a Bull Market. 

An interesting observation about this rally is that market rallied despite the fact that Jackson Hole summit was a non-event with Mr. Bernanke delaying comments on possible QE3 till September. This kind of behavior underscores the fact that once the markets are in a rally mode, FED's statements do not matter. 

Note: Understand, Survive and Thrive is a market analysis, market timing, risk management and trade identification service. Until unless we have enough subscribers to take up Market Analysis as a full-time job, it will be difficult to publish real-time market signals with work and school. Trading numbers are based on our personal trades.


If you like this article, Subscribe to E-mail Analysis 

Book your Subscription Spot (Only 30 spots left) 

Monday, August 29, 2011

Predicted vs Happened!!

In the name of God, the most gracious, most merciful

After first accurately predicting the August 23 (+/- 4 days) bottom on August 4, 2011, the Trading Algorithm once again accurately analyzed the market on Thursday - delineating the possible market trajectory. These two cases exhibit two different Bottom Picking and Turn Point Identification strategies employed by Understand, Survive and Thrive:

1- Inflection Point Model - Predicting Bottom Timing: August 23, 2011 Bottom Call
2- Market Structure EW Analysis - Predicting potential market bottom level: August 25, 2011 Correction Call

Following images show the Predicted Market Trajectory vs Actual Market Behavior.
Predicted
Actual - Happened
The market bottomed at .786 Fibonacci retracement at 1137. At this level "a" wave also equaled "c" wave. Overall, we saw a 3 wave decline, which stresses the fact that the trend is now UP. Right now, we have a very good buying opportunity, with clearly defined risk-management level (1137).

MARKET ANALYSIS
Hurricane Irene turned out to be fairly benign, which is very good for the markets. With markets in the 3rd wave of a new Uptrend, we are about to witness a very strong rally. Since next UST Inflection Point Model turn date is in September, upcoming rally can last for a good 3 weeks. Its a good thing that we went partially long on Friday.

Markets have so far held above the August 23, 2011 low, thus, clearing the path for a sustainable rally in the coming weeks. Furthermore, over the past 2 weeks market indices have carved out a very nice base formation. These formations can provide a very good rally launch pad.

If we open strong tomorrow, it would suggest that we can raise the trailing stops to reduce the risk associated with the long positions. EW stops and trailing stops will be discussed in the upcoming Trading Algorithm summary.

INTERESTING OBSERVATIONS
I have always been fascinated by market's inherent Elliott Wave nature. It seems like whenever the markets are in an uptrend, we get surprises to the upside no matter whether the news is good or bad. Similarly, whenever the markets are in a downtrend, we get surprises to the downside no matter whether the news is good or bad.

This behavior is clearly evident from the Hurricane Irene event. Although it was supposed to wreck havoc throughout the East coast, it did not cause significant damage. Some might suggest that because it was not disastrous that is why markets are rallying. On the contrary, I tend to think that markets were supposed to rally no matter whether what Hurricane Irene did.

FUTURE POSTS

  1. Trading Algorithm Update
  2. Subscription Update
  3. Pick the Turn Point Challenge Review
  4. Inflection Point Model Update
If you like this article, Subscribe to our E-mail Analysis 

Friday, August 26, 2011

Short-term Market Structure - PTP 7

Update (August 26, 2011 - 10:23 AM)
As per last night's posting, we have either bottomed or will bottom near current levels in the next 1 or two days. This will be followed by a sharp rally. UST Inflection Point Model's August 4, 2011 prediction of bottom on August 23 (+/- 4 days) has held so far. If it holds then be on the look out for a sharp rally into September's next FOMC meeting.

I have posted all of the UST Trading Algorithm updates on MarketWatch for your historical reference. 

Note: I think its prudent to go long on a small position here with stop below the low (tight risk-management), with goal of going full long next week. - let Hurricane Irene pass.


ORIGINAL POST (LAST NIGHT)
UST Trading Algo exited longs last morning (please review Trading Algorithm Update) based on the completion of 5 wave Elliott Wave formation (shown below) in all the major indices: SP500, DJIA and Nasdaq. This formation shows a clear five wave advance. Five wave advances are followed by 3 wave correction. This scenario coupled with the fact that we are in a downtrend, coaxed UST Trading Algo to take profits.

UST Trading Algorithm assumes that the trend is like a River Current: One should always swim/trade in the direction of the current; against the current trades should only be undertaken with stringent risk-management measures. Since no one can be a 100% sure of potential market direction and trading is a probabilistic game, one should always take the highest probability trade and secure profits.

Note: If right now we were in an uptrend and had seen the same formation, UST Trading Algo might have held some of the longs. This is because the probability of an upside break-out would have been very high. But right now - its better to be safe than sorry.


The above chart shows a clear five wave advancing structure. This structure carries far-reaching market implications in the coming weeks:

  1. It suggests that markets bottomed within the turn-window of August 23 (+/- 4 days)
  2. Five wave advances indicate change of trend: Down to Up
  3. Current correction (started August 25) should end above the August 23, 2011 low
  4. Important support will be found near 1145 and then at 1130 (SP500), which contains Fibonacci and EW support 
  5. Starting next week buying the dip will be the right approach (After Bernanke Speech and Hurricane Irene have passed)
  6. If market does not hold above August 23 low then we can see a sharp decline because the next turn window is in September (will soon post the data)
  7. If market holds above August 23 low then we can see a sharp rally because the next turn window is in September (will soon post the data)
  8. Risk management is the key because we are still in a downtrend

Conclusion:
Markets are at a very critical juncture right now. UST strategy will be to go long early next week. However, success of this strategy will be governed by the degree of pessimism that is brought back into the market by the current decline. If we see excessive pessimism then we will rally, but if everyone decides to buy this dip then markets will nose dive. Therefore, sentiment will hold the key. UST will try to keep its readers updated through Market Matrix analysis.

Note: Reaction to tomorrow morning's Ben speech will be much important than the speech itself.

Q. Lets see how many people are disappointed by Bernanke or are terrified by Hurricane Irene or are spooked by the European debt problems, over the next few days??


If you like this article, Subscribe to our Free E-mail Analysis 

Thursday, August 25, 2011

Trading Algorithm Update - August 25, 2011


Market: Bear
Defining Level: 1204
Trend: Down
Defining Level: 1285
4/8 Trend Change Confirmation (Up to Down): Yes
Current Trade: Long from 1130
Profit Objective 1: 1164                                                   Trailing Stop (closing): 1164
Profit Objective 2: 1197                                                   EW Stop: 1156
Status: Exited All Long  for 3.2% profit (Updated Close of Trading Day)
Next Trade / Model Based Approach: Pick Bottom in a few days
Stop:                                                                                  Risk: 
Risk Associated with trade: HIGH (Bottom picking in a Bear Market is dangerous)
Turn Window: August 23 (+/- 4 days) รจ
Market turned in the turn window
Scenarios
1-       Market bottoms in turn window
2-       Market tops in turn window
3-       Market double bottoms and breaks out
4-       Market double tops and breaks down
Observations:  Markets turned during the turn window. Pessimism is evident from surveys, growth forecast downgrades and news articles. It seems possible that either markets might continue higher into the Jackson Hole Summit (Friday) and test 1200 level, or Markets might have already topped out at 1187 (Thursday opening - close enough).  After the summit, we might see a “Sell the News” event with markets declining over the next few days. If the market can hold above 1150 then we will see a sharp rally above 1200 level. However, if the market breaks below 1150 (1130-1150 range) then we could see a new low. It will be interesting to see how investors respond to the upcoming decline (Buy the Dip or Short the market). Sentiment will be the best guide to identify market's course over the next few weeks. On the coming decline, we will re-evaluate the situation about whether to buy or to sell short.


If you like this article, Subscribe to our E-mail Analysis 

Wednesday, August 24, 2011

Trading Algorithm Review - PTP 5

Excellent market call, followed by an excellent Rally!! (by the grace of God) 
   
This behavior again proves the accuracy of the Understand, Survive and Thrive's trading methodology. UST's Inflection Point Model predicted, on August 4, 2011, that markets will bottom on August 23, 2011 (+/- 4 days). On August 22, 2011, Trading Algorithm generated a bottom signal coupled with a risk-management strategy. Long behold, markets rallied strongly yesterday. At this point, I would like to emphasize that risk-management should remain the key.

UST's TRADING ALGORITHM RECAP (For detailed market timing, visit: Market Timing)

  1. Trading Algorithm generated a sell signal at 1322 (SP500), on July 27, 2011, saving followers 17% in 2 weeks and avoiding the mini-crash. 
  2. On August 18, 2011, UST's Trading Algorithm shorted the market at 1195 (SP500) and covered at 1124, for a 4.5% profit in 4 days. 

UST PERFORMANCE (July 24, 2011 to August 24, 2011):

SP500: -13.6%     vs     UST Model: +3.2%     =>     UST Net Gain = +16.8%

UST Trading Algorithm has beaten SP500 by 16.8% over the last month alone. 

After reading various articles in the news and analyzing the performance of several fund managers, Trading Algorithm's 95% accuracy, in today's dangerous markets, is a pure blessing of God. A blessing which UST team has been sharing with its readers for the past 8 months, and will continue to do so.

HUMAN PSYCHOLOGY & FINANCIAL MARKETS
Yesterday we received very bad economic data and a 5.9 magnitude earthquake which rocked the East Coast. Although such an event could have easily resulted in a significant sell-off because East Coast is the financial and political hub of the nation, it did not result in any panic. Instead, market continued to rally. This shows that the markets are governed by human mass psychology. Once this psychology turns bullish/optimistic not even bad events can derail the market.
     Since financial markets are the best barometer of the collective human psychology, understanding the structure of the financial markets can be very useful and rewarding. It can help predict and identify various social trends. This identification would lead to better business decisions and creative investment opportunities.

At some point in future, I would like to initiate a stock market analysis based small/new business consulting service, helping individuals identify the best business potentials and enacting appropriate business strategies.

MARKET OVERVIEW
Although markets did bounce within the turn window, they are in a downtrend. In order for this trend to reverse, markets will need to do a lot of work. Over the next few weeks, we will see sharp rallies and declines. As long as 1204 (SP500) level is not broken to the upside, we should remain cautious of a potential downside reversal. Therefore, one should have tight trading stops to preserve profits. In the next post, we will analyze the latest Inflection Point Model results.

SUBSCRIPTION
It has been finalized that subscription will only be opened to 60 individuals, either in October or November 2011. Right now we only have 42 subscription spots left, as several individuals have already booked a subscription spot by sending a request to subscription.ust@gmail.com. Initial subscribers will pay introductory rates (mentioned in subscription section) for the next 6 months. After initial subscription phase is complete, subscription will be closed till at least April 2012.
     Subscription details (Payment Method, Trial Period, and other details) will be mailed to interested individuals in mid September 2011. If you want to subscribe or want to book your subscription spot, please contact UST team at: subscription.ust@gmail.com

Tuesday, August 23, 2011

Trading Algorithm Summary - Bottom Picking (PTP-4)

Recently, a friend asked if we can provide real-time updates about the Trading Algorithm signals. Unfortunately, with school and work, it will be difficult to post real-time Trading Algorithm signals until unless we have enough subscribers or if we decide to take up trading as a full-time profession.

However, in order to honor this request, I have decided to post a Trading Algorithm Summary (shown below) once or twice a week. It will help readers in making trading decisions based on important trading and stop levels.

Market: Bear
Defining Level: 1204
Trend: Down
Defining Level: 1290
4/8 Trend Change Confirmation (Up to Down): Yes
Current Trade: Short from 1195
Profit Objective 1: 1159                                                   Trailing Stop: 1171
Profit Objective 2: 1124                                                   EW Stop: 1145
Status: Exited Short @ 1124 for 4.5% profit
Next Trade / Model Based Approach: Pick Bottom (50% capital – to minimize risk)
Stop: 1121          Risk: Less than .5% of capital
Risk Associated with trade: HIGH (Bottom picking in a Bear Market is dangerous)
Turn Window: August 23 (+/- 4 days) รจ
We are in the turn window
Scenarios
1-       Market bottoms in turn window
2-       Market tops in turn window
3-       Market double bottoms and breaks out
4-       Market double tops and breaks down
Observations:  Markets have entered the turn window. Pessimism is evident from surveys, growth forecast downgrades and news articles. Markets have sharply declined over the past few days, creating a double bottom scenario. Bullish non-confirmations between transports and industrials. Markets can double bottom over here. Therefore, pick bottom with a tight stop. With such a low risk and huge profit potential, this risk is worth taking.

Note: Trading Algorithm goes hand in hand with the Market Matrix, Inflection Point Model and Market Barometer. Therefore, it should not be assumed that UST generates buy/sell signals purely based on these levels.

Thursday, August 18, 2011

Market Structure - PTP Episode 3

We finally entered the turn window yesterday (August 17). Interestingly, the market rose into the turn window which suggests that the stronger potential is that we have seen the top of the recent rally yesterday. 
     As mentioned in the last post, there are two prominent market trajectory potentials. I will try to discuss both of these potentials here, so that we can better define whether the upcoming turn window will give way to a rally or a decline or both.


Bear Market Scenario:
     The recent decline has resulted in a change of market's character from Uptrend to Downtrend. This decline might be the start of something extremely significant and potentially disastrous for the global economy. This scenarios means that the stock market ended its rise from July 2010 in an ending diagonal pattern (shown below), with a shortened last rise. This shortened rise gave way to a Head and Shoulder's topping pattern. Ending diagonals are terminating moves, followed by sharp declines (witnessed by the global equity markets).
     However, we have not seen a complete Elliott Wave decline pattern, suggesting that a bottom is not in place. This behavior when combined with rise in optimism among investors over the last week is a catalyst for further decline. Further decline would be the 5th wave required to complete the decline pattern. 
After the pattern is complete, markets will rally, correcting the previous decline from 1350 to 1100. 


Bull Market Scenario:
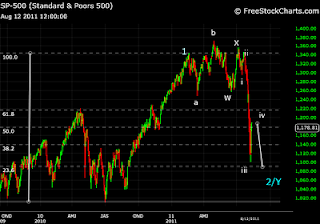
     The recent decline is a 3 wave correction (W-X-Y), with the Y wave being sub-divided in to 5 sub-waves. This pattern also requires a final 5th wave decline (similar to above mentioned scenario). This scenario is shown in the chart below. 
     The current decline could end at 78.6% retracement of the rise from July 2010 to February 2011.  78.6% retracement is a typical retracement for the 2nd wave. According to this scenario, market holds very strong rally potential to new all time highs. 
     However, in order for this scenario to play out, market (SP500) should rise above 1300. But this kind of rise does not occur over night and demands choppy up/down base-building process. Therefore, there will be buying opportunities in the near future with minimum capital risk.


Conclusion
     In both cases, market should decline over the next few days. It would be very interesting to see if the market declines in the coming week and then bottoms by August  26, 2011 - coinciding with Federal Reserves' Jackson Hole summit. This is the same conference, which initiated QE2 based rally in the global equity markets.


Note: Trading Algorithm generated a sell signal yesterday at 1195 (SP500) based on the test of the UST proprietary MA. In the next post, I will discuss the Trading Algorithm status and important levels.

Friday, August 12, 2011

500 Point Rally and Market Recap

Wow!!! Trading Algorithm's sell signal saved the followers more than 17% in just 2 weeks. 


Last week turned out to be a very volatile week in both financial and political worlds. Before going on vacation, UST stated on August 6, 2011:


"Next few days will be very interesting with considerably choppy market action. Therefore, the best strategy will be to stay on the sidelines, continue to analyse the market, define risk and trade based on Trading Algorithm signals."


In the hindsight, it seems like a very good advice. 


Yesterday's 400+ point rally, followed by today's 100 point advance, might have forced several analysts to proclaim that the market has bottomed. However, last week's precipitous decline has extensively damaged the technical health of the financial markets. In fact, according the UST's proprietary indicators we are now officially in bear market territory. This means that the best approach will be to sell rallies, instead of buying dips. Because in a down trend, good news are sold and rallies are short-lived.


Market Matrix is also not yet indicating a strong buy point. Furthermore, last few days have seen a rise in optimism among the investors. Optimism in the face of such week price action, does not bode well for the overall market. Moreover, recent decline was very extreme in nature. Extreme declines are often followed by price retests. This technical behaviour, when combined with current sentiment backdrop and turn window of August 17 to August 26, leads to the conclusion that we will further decline before putting in a bottom.  


Although picking the bottom in a down trend is not a good trading strategy, we will keep a sharp eye on the market structure and Inflection Point Model. Overall, current market structure leads to two possible market scenarios:


1- We have entered a new bear market, and will end up in a depression
2- Market will soon bottom and lead to a significant rally. 


Each scenario can be demarcated by certain price levels. And in both cases we will experience extreme price movements. Therefore, it will dramatically pay-off to be aware of the pulse of the market, and trade accordingly.


In next issue of Pick the Turn Point series, we will analyse different market structures, price levels and Trading Algorithm's signal level.

Saturday, August 6, 2011

US Downgrade: Market Crash or Rally?? - Episode 2

Today US lost its AAA rating: An event which was once considered unimaginable has finally taken place. According to the main stream financial median, a Debt Downgrade could have severe consequences, like rising interest rate and declining stock market. This kind of behavior would result in reduced economic activity, ultimately leading to another recession.

At this point, I would like to ask: Are we going to witness a dramatic sell-off Sunday evening? Or will this downgrade give way to a temporary rally? Based on our trading experience, current market structure and Inflection Point Model turn window of  August 17 - August 26, it would make sense for the market to shrug-off the downgrade news and rise for a few days. This rise would lead to a final decline into the turn window.

In any case, next few days will be very interesting with considerably choppy market action. Therefore, the best strategy will be to stay on the sidelines, continue to analyze the market, define risk and trade based on Trading Algorithm signals.

Note: I will be on vacation starting August 7, 2011, till August 11, 2011. After vacation we will thoroughly re-analyze the Market Matrix to decipher whether the market will bottom in the Turn Window or will give a selling/shorting opportunity.

Thursday, August 4, 2011

Inflection Point Model: PTP Campaign - Ep 1

Although anyone who had followed Understand, Survive and Thrive's Sell Call would have saved over 10% in less than 2 week, I myself did not anticipate such significant decline. This kind of severe sell-off begs the question whether we are approaching crash territory or are we near a bottom?

Throughout today, I have been seeing a lot of TV personalities saying that this is a great buying opportunity. In my humble trading opinion based on extensive trading experience, bottoms are not formed when everyone knows that it is a buying opportunity. This being said, we have certainly started to see some very good PANIC signs. Therefore, we can say that based on psychological analysis and market understanding we are near a bottom but might not have bottomed yet. 

Inflection Point Model
In any case, our trades are governed by the Trading Algorithm, not by our opinion. In this regard, we re-ran the proprietary Inflection Point Model, to discern the next possible Stock Market Turn date (Pick the Turn Point). The program output is given below:
Analysis
According to the two models, the next turn date is scheduled for August 23, 2011 (+/- 4 days). Moreover, both models are showing a potential turn, thus amplifying turn possibility. To our amazement, the amplitude of the turn point is very high. In fact, this amplitude is comparable to the amplitude we saw at the March 2009 bottom. Hence, we might be in for a significant turn point. Interestingly, this time frame also coincides with "Options Expiration Week" and Federal Reserves' Jackson Hole summit, where FED last year announced QE2. 

All of these observations, collectively force us to observe that we might witness another significant announcement from the Fed, which might mark the bottom of the current decline. (If the uptrend is intact). Otherwise, if we have entered a bear market, next turn point could mark a top. 

The Inflection Point Model is the primary reason why we has not tried to pick the bottom in this market, even when various famous individuals like Lazlo Brinyi and Biggs are recommending to hold the stocks. 

Bottom picking is hard, and can result in significant declines. Some people might assume that we will rally based on employment numbers tomorrow, but we believe that any significant rally cannot take place until unless the Trading Algorithm gives a buy signal. Hence, even if the market rallies tomorrow, we will intently and safely wait on the sidelines for the turn window.

Conclusion
Now that we have a turn window date, we will concentrate on how to evaluate the market going into the turn window. Risk management is the key to success. In the next post, we will evaluate different market structure scenarios which can take place and how to play them for profitable trade in these tumultuous times. 

Pick the Turn Point Campaign - August 2011

Pick the Turn Point Campaign's Introductory Video has been released. It is available in the sidebar or at Youtube.

Next Posts:

1- Inflection Point Model: Identify the turn date
2- Market Structure Analysis: Identify the market decline potential


Note: I will be on vacation from August 6, 2011 to August 10, 2011.

Tuesday, August 2, 2011

Latest Market Timing in Charts

Buy Signal @ SP500: 1302 on July 19, 2011

Sell Signal @ SP500: 1322 on July 27, 2011

Today the market closed at 1254.

Please review the Trading Algorithm Buy/Sell Signals (by the grace of God).

Inflection Point Model Signals
Over the past 2.5 weeks the Trading Algorithm not only generated a 1.5% Profit, it also allowed us to preserve capital. In fact, it resulted in almost 5% savings by generating a sell signal at 1322. An average investor in the stock market with $20,000 in capital would have saved almost $1,000 in less than 2 weeks with this information along with significantly reduced stress levels. This $1,000 savings is surely more than double the cost of possible annual subscription (fee not decided yet).

Moreover, Inflection Point Model has generated a turn signal at every turn point. Therefore, it is a pretty accurate market timing model.

Note:
As you might know, UST team is considering initiating a subscription services for only 50-60 subscribers (first come-first serve). Please contact us for more information.  


Why Trading Algo Sold Before the Debt Deal?


On July 27, Trading Algo generated a sell signal at 1322 (SP500). Since then markets have continuously declined (SP500 low of 1273 seen today). Although we have seen the debt deal materialize, UST's proprietary model is still far away from a buy signal. Such market behavior gives rise to the question, "Why did the Trading Algorithm got into cash at 1322, when everyone knew that a debt deal was certain?" 


Debt Deal and Market Response
Let us start with a question that was asked yesterday at the blog, "Market futures up due to budget deal. What is the S&P buy signal number?? Thanks." My response was, "Buy Signal will be generated above 1320. It will be interesting to see how the next few days unfold. Since debt deal was a known, are we going to see sell the Rally approach? Moreover, the bill has not passed the Congress yet. You never know if the Congress pulls-off a last minute Tuesday night drama, which could send the market down again. In any case, it is time stand on the sidelines for next few days."

This question was very thought provoking as the futures were up more than 150 points over night. However, as suggested in the reply the market gave up all the gains and some, during the initial trading hour. This kind of behavior is not only strange, it shows us that "News" does not govern the market. 

The News based trading dilemma is widespread in the financial markets. This is primarily why, UST developed the Market Matrix - a comprehensive analysis of market's strength. This analysis not only tells us where the market is headed, but also whether to trade in that direction or not. At Understand, Survive, and Thrive, we believe that market is like a river, and trading along the flow of the river is the best strategy. This is why when the market declined below 1322 and triggered the proprietary 8/4 indicator, we sold. 

Primary Reasons of Selling
First of all, last week investment advisers were not worried at all. In fact at one point they were 49% bullish according to both HSNSI and Investor Intelligence survey. This was quite worrisome. After all, if the threat of Uncle Sam defaulting or a downgrade of his debt is not enough to build a robust wall of worry, what will it take?


Secondly, the market turn (top) coincided with the Inflection Point Model (shown on right) signal. This signal, though weak, was sufficient to trigger a warning signal. Technical indicators were continuously deteriorating, and market structure was evolving into a form which resembled correction rather than start of a new up trend.

All of these developments when coupled with the 8/4 sell trigger were sufficient to get us out of the market. Even though it was certain that the market might rally based on the news of Debt deal. So I hope that all of you have seen the benefits of using UST's Trading Algorithm.

Pick the Turn Point Challenge
Now, the trend is neutral to down. There are three possible market structure scenarios. New Inflection Point date has been generated. Trading Algorithm is continuously updating its buy points. This is the most opportune time to launch the Pick the Turn Point Challenge. Here, we will try to identify the next market turn point. So stay tuned.