We finally entered the turn window yesterday (August 17). Interestingly, the market rose into the turn window which suggests that the stronger potential is that we have seen the top of the recent rally yesterday.
As mentioned in the last post, there are two prominent market trajectory potentials. I will try to discuss both of these potentials here, so that we can better define whether the upcoming turn window will give way to a rally or a decline or both.
Bear Market Scenario:
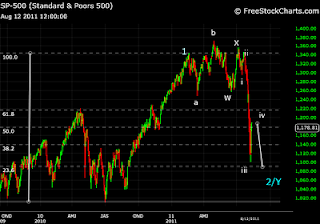
The recent decline has resulted in a change of market's character from Uptrend to Downtrend. This decline might be the start of something extremely significant and potentially disastrous for the global economy. This scenarios means that the stock market ended its rise from July 2010 in an ending diagonal pattern (shown below), with a shortened last rise. This shortened rise gave way to a Head and Shoulder's topping pattern. Ending diagonals are terminating moves, followed by sharp declines (witnessed by the global equity markets).
However, we have not seen a complete Elliott Wave decline pattern, suggesting that a bottom is not in place. This behavior when combined with rise in optimism among investors over the last week is a catalyst for further decline. Further decline would be the 5th wave required to complete the decline pattern.
After the pattern is complete, markets will rally, correcting the previous decline from 1350 to 1100.
Bull Market Scenario:
The recent decline is a 3 wave correction (W-X-Y), with the Y wave being sub-divided in to 5 sub-waves. This pattern also requires a final 5th wave decline (similar to above mentioned scenario). This scenario is shown in the chart below.
The current decline could end at 78.6% retracement of the rise from July 2010 to February 2011. 78.6% retracement is a typical retracement for the 2nd wave. According to this scenario, market holds very strong rally potential to new all time highs.
However, in order for this scenario to play out, market (SP500) should rise above 1300. But this kind of rise does not occur over night and demands choppy up/down base-building process. Therefore, there will be buying opportunities in the near future with minimum capital risk.
Conclusion
In both cases, market should decline over the next few days. It would be very interesting to see if the market declines in the coming week and then bottoms by August 26, 2011 - coinciding with Federal Reserves' Jackson Hole summit. This is the same conference, which initiated QE2 based rally in the global equity markets.
Note: Trading Algorithm generated a sell signal yesterday at 1195 (SP500) based on the test of the UST proprietary MA. In the next post, I will discuss the Trading Algorithm status and important levels.


No comments:
Post a Comment
I would love to hear from you! Please leave your comment below!!