
Following charts show the development of the triangle in the global dow. Following pattern was not seen at any place on the web. It was identified by the UST team based on the usage of Inflection Point Model and the associated market turn.
 |
| March 24 - Nearly Complete Triangle |
 |
| March 26 - Initial Breakout |
 |
| March 27 - Consolidation after breakout |
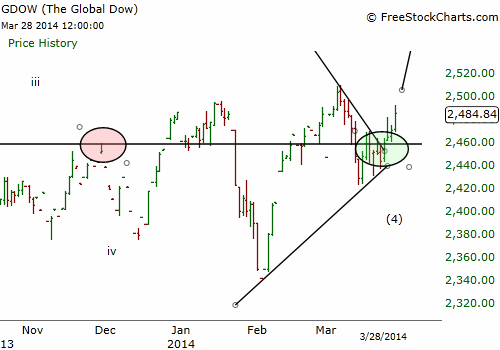 |
| March 28 - Breakout Continues |
 |
| April 1 - New Highs |
IPM Trade Matrix Long Trade is continuing. No changes in the leves tonight. Will update trade data tomorrow.
For Blog updates on Google+ add: Understand Survive Thrive
For Blog updates on Twitter, add: @survive_thrive
For E-mail updates:

No comments:
Post a Comment
I would love to hear from you! Please leave your comment below!!