
MARKET REVIEW
 |
| Predicted |
 |
| Happened |
Last week’s special Market Matrix update pretty much summarized the sentiment and Elliott Wave picture and highlighted the reasons behind uncertainty i.e. Inflection Point Model turn dates. The analysis came to two conclusions:
1- If the market declines sharply in conjunction with a sharp rise in US Dollar then it would suggest that we entering a sharp decline phase. Soon we will start seeing bad economic data and European crisis will get worse.
2- On the other hand, if the market stays above 1200 and US Dollar starts to decline then it would mean that markets bottomed during the IPM turn window and will rise for 1-2 weeks.
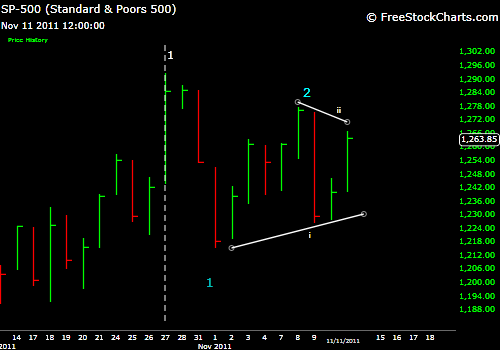
By breaking below 1200 last week, SP500 completed the 8/4 test which resulted in a downside reversal. Afterwards, market swiftly declined to 1158. Now we are in a well-defined Bear market.
As far as the fundamental developments are concerned, the sovereign debt crisis is spreading to the core of European Union. Since markets do not go down in a straight line, we will see rallies based on hope and anticipation. However, until unless we see a trend reversal, all rallies will be good shorting opportunities (like the end of October rally, which was rightly named as wave 2 rise by UST).
TRADING ALGORITHM REVIEW
Although UST Trading Algo did not lose any money as the market declined more than 7% (1250 to 1160), it missed out on an exciting shorting opportunity. The worst part is that the UST Trading Algo was on the right side of the trade i.e. shorted SP500 at 1241 and did not generate a buy signal. However, it was human emotions that overcame the Algorithm and short positions were closed around 1250. In other words, market succeeded in throwing us off its back by gyrating sideways, before the major decline.
As a result, a comprehensive trading strategy re-evaluation was performed over the Thanksgiving break. The goal was to further reduce emotional aspect of trading. This was achieved by realizing the fact that trading strategies should be treated using varying order of significance. And that trading in direction of the primary trend should be held above signals generated by IPM or Elliott Wave analysis. Furthermore, a better proxy index was identified, which adheres to the trading rules much more smoothly than SP500.
After comprehensive evaluation, a trading scheme has been devised for different types of markets (Bull vs Bear). This trading scheme will be posted online in the next few days.
CURRENT MARKET ACTION
As far as the current market is concerned, it is alarmingly to see that market participants are not exhibiting any signs of real panic. Although the market has declined more than 7% in less than 2 weeks, there has not been any spike in volume, surge in pessimism, jump in put-call ratios or any other sign of capitulation. Market structure favors further decline and the supporting markets are showing no support.
In other words, we are most probably headed towards a test of the October lows, until unless we can break above 1220. However, one thing that is currently in market’s favor is the fact that it is pretty oversold. Hence, we can see a sharp rise for a few days. Please keep in mind that this rally could be a good shorting opportunity.
Overall, we are now in a well-defined downtrend and are back in the Bear market territory. Typically, markets whipsaw only once before changing their trend. If this is true then we have most likely already seen the whipsaw:
Bull => Bear - 08/2011 => Bull (Whipsaw) -10/2011 => Bear (Final) - 11/2011
Normally, Bull or Bear market remains intact for several months. Therefore, if we do not break above 1220 real soon (by the end of the year), we will most probably remain in a bear market for the next several months. Under such circumstances, the best strategy would be to pick tops during the IPM turn dates.
Please keep in mind that like a Bull Market when the market rises persistently, in a Bear Market, market will fall. Although we will experience sharp rallies along the way, market will continue to decline with a series of lower highs and lower lows. So the task should be to identify the primary trend, pick trading locations, manage risk, take profits and re-evaluate. I hope that the enhanced trading scheme analysis will bring some clarity into current trading atmosphere.
Market update schedule (tentative):
11/28/11: Market Overview
11/29/11: Inflection Point Model (Primary Subscribers)
11/30/11: Trading Scheme Update + Trading Algorithm Update (Subscribers)
11/31/11: Trading Scheme Update
12/1/11: Trading Algo Update (Primary Subscribers)

What's the name of the better proxy index you found?
ReplyDeleteThanks
Its a combination of Russell 1000 and global stock market index. Unlike SP500, this combined form results in greater diversity. SP500 has become a trading instrument by the introduction of ETFs and futures. However, I have to further test the new index to ensure that it works in real time.
ReplyDelete