Twitter

Wednesday, January 30, 2013

Ending Diagonal or Not??


Over the past few days I have been seeing several bloggers, who missed the 12% rally from Nov bottom to January high, suggesting that the market is carving out an ending diagonal. And once this pattern is completed, we will fall of the cliff. Proponents of this pattern include Elliott Wave followers and chartists. However, based on UST’s Market Matrix analysis and proprietary trend indicators, it is highly unlikely that we are in an Ending Diagonal pattern. In the end, all those who are promoting the Ending Diagonal concept could once again miss another buying opportunity. UST's primary E/W count is presented here.

First of all, let me be very clear that Ending Diagonal patterns are a reality! They do exist. And they do result in sharp moves in the opposite direction. Ending diagonal patterns are defined as:

"An ending diagonal is a special type of wave that occurs primarily in the fifth wave position at times when the preceding move has gone "too far too fast," as Elliott put it. A very small percentage of ending diagonals appear in the C wave position of A-B- C formations. In double or triple threes (see next section), they appear only as the final "C" wave. In all cases, they are found at the termination points of larger patterns, indicating exhaustion of the larger movement.

Ending diagonals take a wedge shape within two converging lines, with each subwave, including waves 1, 3 and 5, subdividing into a "three," which is otherwise a corrective wave phenomenon. The ending diagonal is illustrated in Figures 8 and 9 and shown in its typical position in larger impulse waves." 

And they look like:


Following DJIA chart shows an ending diagonal drawn in the current market. There are many aspects of this ending diagonal which fulfill the technical requirements of this pattern.

DJIA - Weekly Chart 
DJIA - Daily Chart

Characteristics of this Ending Diagonal:
  1. Structure: Market traced out the ending diagonal pattern in an overlapping manner. Moreover, sub waves are seen as divided into 3-waves instead of 5. 5-wave advances suggest impulsive rise, while 3-wave and overlapping advances characterize correction or ending diagonal.
  2. Rapid Rally: This pattern has formed after more than 100% market rally in less than 4 years, which can be classified as a sharp rise. Therefore, sharp rise requirement has also been satisfied.
  3. Sentiment: Sentiment on this latest up move has touched extreme optimistic levels - levels not seen in many years. Therefore, it meets the requirement of optimistic extreme.
  4. Divergence: Finally, there is a clear divergence between large cap indices like DJIA and SP500, and Nasdaq. This divergence can be a negative omen for the overall market, as divergences typically occur towards the end of an advance.

Although above mentioned reasons support the possibility of an ending diagonal being formed, there are several reasons why the Ending Diagonal pattern assumption is doubtful. These reasons are based on personal experience, market’s analytic study and interpretation of Elliott Wave pattern in light of Market Matrix indicators/IPM Model.

In order for the market to confirm an ending diagonal, we need to see a very sharp decline, which will break below Nov 2012 lows. However, following reasons do not support the concept of a sharp decline.

Market developments that do not support Ending Diagonal:
  1. Internal market strength is very strong, which suggests that we have further rally left
  2. Recent rally saw a market breadth spike, which has previously been a sign of further gains after a brief pause.
  3. Start of new Bull market in Global Markets and Emerging Markets (A special report was emailed to subscribers in early December highlighting this development). A new bull market typically lasts longer than only 2 months. 
  4. A lot of people are publicizing and accepting this pattern, as logical next step. I have noticed that whenever a pattern becomes public news, it rarely happens
  5. No major sell signal yet e.g. 8/4 test etc.


Conclusion:
Yes we will see a market decline, but it will not be because of Ending Diagonal. Instead it will be because of Elliott Wave pattern shown on the UST blog, IPM Model top date, elevated Sentiment, trend line resistance, and overbought conditions. People who believe in the ending diagonal will go very short on this decline, and will most probably not cover at the bottom. Hence, they will not only not make money based on their ending diagonal belief but will also miss the upcoming rally. In order for our E/W count to remain intact, market should not decline below …


Weekly IPM Model:
Latest IPM Model run on the weekly time frame resulted in a very unique output. This output will be shared with subscribers in next 1-2 weeks.
  

Subscription
If interested in IPM Model Subscription, please fill out the form below. IPM Subscription will be closed after a limited number of subscribers to maintains models validity. Model Performance

Tuesday, January 29, 2013

Market Analysis - 01/28/13

First of all, thank you all for being patient as there were no updates on the blog for almost 3 weeks. You can blame it on the Flu!! By the grace of God, I am now feeling much better and will try to post more frequently. Overall, markets have been going up persistently since November. Although main stream media is now getting excited and is suggesting that we are going to all time new highs, UST subscribers received a special report in early December highlighting the fact that the global markets had started a new bull market in early December.  

In fact, SP500 has gone from 1350 to 1500 in 2 months. This amounts to 11% rise or 66% annual gain. However, now market is reaching a crucial juncture. Along with the IPM Model Turn date, there are several Market Matrix red signals being generated right now. Market Matrix components showing red signals include:

  1. Elliott Wave structure
  2. Sentiment
  3. Technicals
  4. Leading markets
Lets understand the Elliott Wave structure of these markets.

SP500, DJIA and Global Stock Market index, all have pretty much the same wave structure. Therefore, we will use SP500 to evaluate the market structure as of January 25, 2012. Our primary count remains the same as it was presented in December 2012 because market has closely adhered to our analysis.  Following image shows what was predicted in early January.


As shown below, the market rose persistently during January in 3 of 3 wave. It was mentioned previously that 3 of 3 waves can last for a long time. During 3rd waves surprises normally happen to the upside. This is exactly what we have seen so far i.e. even with marginal earnings, Israel elections and debt-limit/sequestration concerns, market kept on rising. In this regard, IPM Model helped us a lot. IPM Model enabled us to remain long from end of December to late January (exact dates already mailed to subscribers). Thus, allowing us to reap most of the gains in this rally.


Please note that no rally continues forever and no market goes up straight. We are about to witness a similar situation in the U.S. and Global Markets. As of today, markets are approaching the end of wave (iii). After this markets will undergo minor wave (iv) correction followed by a rise to complete wave 3 (as shown above). Wave 3 completion will give way to wave (4) decline at a higher degree of trend. In other words, market will continue to go sideways/down till the next IPM Turn window (date will be emailed to subscribers). Market trajectory projections have already been emailed to subscribers as part of the IPM Model update.

Please note that the IPM Model predicted the current top back in December. During January, we witnessed how the market went from fear of fiscal-cliff to euphoria of all time highs. Right now, we are seeing excessive optimism, technical indicators are very overbought and Elliott Wave pattern is completing. Therefore, risk is very high for a market correction.

Once this sell-off starts, over the next few weeks we will start hearing all the bad news again. One of the most prominent bad news will deal with government spending cuts, and how they will adversely impact the GDP. But based on political analysis, it seems highly likely that sequestration will happen. Implementation of sequestration might result in a stock market rally because very few people will be expecting a rally after such excessive budget cuts.

In the next update, I will discuss the alternative Elliott Wave count which some analysts have been preaching. This count has far reaching bearish consequences. But the technical picture does not support this alternative count. Over the next few days, we will be discussing the nature of the upcoming correction so that one can plan his/her trades.


Weekly IPM Model Update
During this week, subscribers will receive a special weekly IPM Model update. Weekly IPM model outputs have been very accurate over the past few years. The helped in predicting several key market turns, and are sent to subscribers as part of special updates. Some of the past predictions include: May 2011 top, Oct 2011 bottom, Sept 2013 top and so on.


Subscription
If interested in IPM Model Subscription or Weekly IPM Report, please fill out the form below. IPM Subscription will be closed after a limited number of subscribers to maintains models validity. Model Performance


Friday, January 4, 2013

Market Structural Analysis

As markets have rallied over the last few days, Euro has declined. This behavior has been an ominous signal in the past. One key reason behind this sudden decline in Euro and surge in US Dollar is that the Federal Reserves' meeting minutes (yesterday) suggested that "Fed is running out of bullets." (MarketWatch) 

This news headline clearly shows how dire the situation might be i.e. If Fed cannot save us then who can? Add this to Fiscal Cliff - Part 2, which we will be seeing in the congress over the next 2 months over the debt limit issue, and we get a perfect "Headline based" recipe for a sharp market decline.  

This is exactly what is evident on the internet, as many blog writers, individual investors and brokerage houses are trying to fade this rally, based on the above mentioned socio-economic risks. However, a detailed market structural analysis suggests otherwise. 

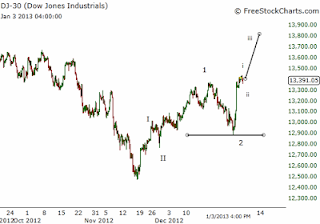
Based on experience, Elliott Waves evolve over time. Since this evolution can take different shapes, it is very important to know the time-wave relationship. In this regard, the following preferred count was presented on the Blog for DJIA. This was the preferred count because it aligned with the IPM Model's turn dates. 

Predicted

Actual

Above chart shows the market structure, as it unfolded in December. Therefore, the 1,2 - 1,2 structure was validated by the market action. 

Today's Elliott Wave Structure
Since the 1,2 - 1,2 market structure was validated by the market, we will keep on analyzing this structure as our primary Market layout. Following chart shows DJIA & SP500 structures with (I,II - 1,2 - i,ii) count on them. According to this count, market should continue to rally in the near term with brief pauses here and there. 


If this structure holds, it would suggest that we are in a 3 of 3 wave. These waves tend to be the strongest of all. Therefore, market should rally stubbornly after completing the near-term 2nd wave. Please note that recent rally did result in sharp declines in VIX and other sentiment based indicators, therefore, markets might need a brief pause before resumption (which might have been completed by yesterday's decline).

The 3 of 3 market case flows well with the next IPM Turn date and the political uncertainty surrounding the markets (mentioned at the start of this post). Markets typically do well when there is geo-political uncertainty. For example, even with a fill-blown Euro crisis in the Europe, German Dax index had its best year in 2012 since 2003 i.e. up 30%. 

In order for this structure to remain valid, market should not violate the following levels:
SP500: 1399
DJIA:  12,887

Although there is one other alternative wave structure (diagonal pattern), but it is such a low probability in the current backdrop of sentiment, IPM Turn date and market internals, that it will not be shared with readers to avoid confusion.

Conclusion:
We are in an uptrend. 3 of 3 waves are very strong waves, and can result in persistent market rise. Next area of the market pause will be at the upcoming IPM Turn date. Market should stay above the critical levels stated above. Global markets remain in a bull market, and we can soon see another rally leg. In a bull market, surprises are typically to the upside.


Subscription
If interested in IPM Model Subscription, please fill out the form below. Next IPM Model update will be sent to Subscribers on Sunday (1/6/2013). IPM Subscription will be closed after a limited number of subscribers to maintains models validity. Model Performance

Thursday, January 3, 2013

UST Quarterly Review


Market (SP500) gained more than 60 points from the Dec 28 bottom in less than a week. These returns when normalized for annual returns come out to be 4.25 * 52 = ~ 220% per year. In other words, it was a sharp rally and took a lot of people by surprise. However, the best part of this rally was that UST subscribers caught most of it.

First of all, I would like to humbly thank God who enabled me to make these accurate predictions through the IPM Model. Secondly, UST team is very excited by the fact that many blog readers benefited from these predictions.

In this post, I will be comparing what was has been predicted by the IPM model since October 2012 i.e. October 2012 to Dec 2012, against what actually happened. Although the predicted market trajectory was just a hypothetical sketch, October/November/December market action very closely followed the projected trajectory.


What is IPM?
Inflection Point Model is a statistical algorithm which utilizes Signal Processing techniques, along with logarithmic calculations to decompose market data into multi-frequency sinusoids. Frequencies with greatest data influence are then analyzed to identify market turn points. This technique can be implemented on Daily, Weekly and Monthly time frames, to come up with most significant turn dates.

Note: IPM model is being improved with numerous new prediction techniques, so that accuracy and reliability can be increased. 

Subscription
If interested in IPM Model Subscription, please fill out the form below. Next IPM Model update will be sent to Subscribers on Sunday (1/6/2013). IPM Subscription will be closed after a limited number of subscribers to maintains models validity.